
Figure 1. Histopathological changes in the liver at 21 days of the experiment.
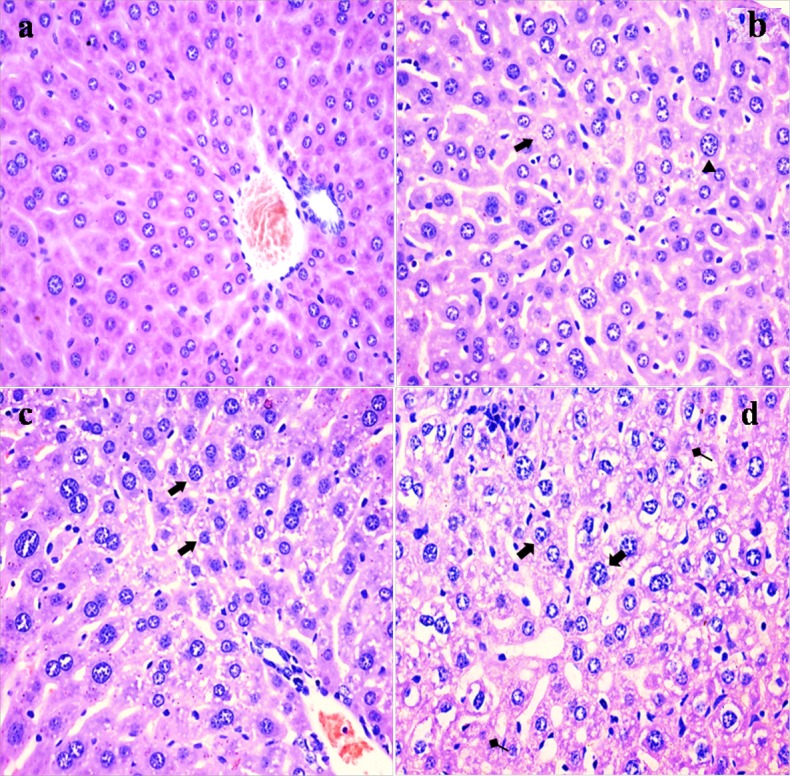
(a) The control group (H&E × 400). (b) The 12 mg/kg group. Hepatocytes are swelled (▲) and show slight granular and vacuolar degeneration (⇑, H&E ×400). (c) The 24 mg/kg group. Hepatocytes show granular and vacuolar degeneration (⇑, H&E × 400). (d) The 48 mg/kg group. Hepatocytes show obvious granular and vacuolar degeneration (⇑). Necrotic hepatic cells (↑) are observed (H&E × 400).