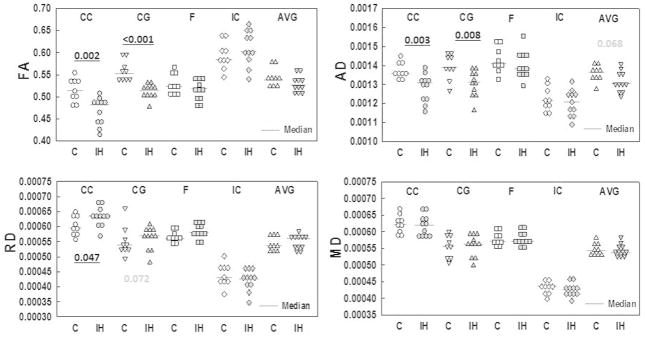
Figure 4.
Changes in FA, AD, RD and MD for the regions of interest (CC=corpus callosum; CG=cingulate gyrus; F=fimbria; IC=internal capsule; AVG=average across all regions. Gray symbols represent pups exposed to IH. Open symbols are room air-exposed control pups. Blue lines indicate the medians. Significant values are shown in bold underline (P<0.05). Non-significant changes with P≤0.08 are shown in grey.

