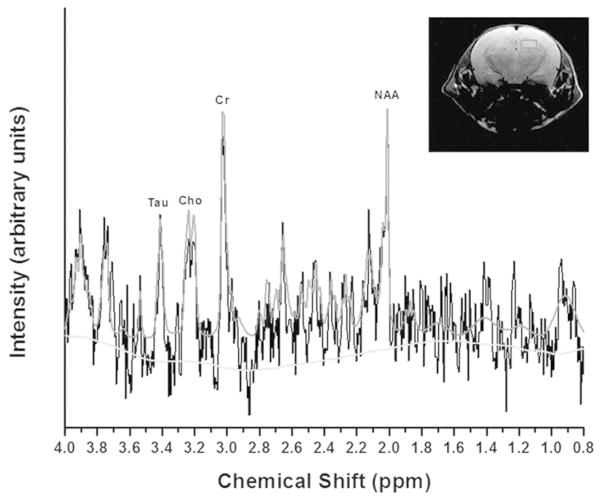
Figure 5.
An example TARQUIN model spectrum from the hippocampus in a P22 control rat pup. The X-axis shows the chemical shift for each peak. Peaks for Creatine (Cr), Choline (Cho), Taurine (Tau), and N-acetyl Aspartate (NAA) are shown. The inset shows the region of interest including the left hippocampus.

