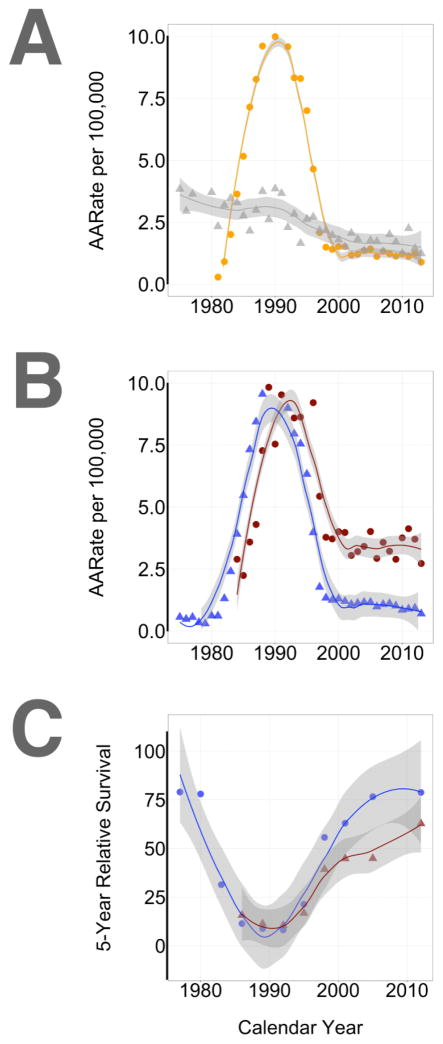
Figure 2. Review of KS incidence rates based on US SEER data (10-15-2016).
Data and graphs were obtained using the SEER data website (http://seer.cancer.gov/explorer/). For panels A–B the calendar year is shown on the horizontal and incidence rate per 100,000 on the vertical axis. Panel A stratifies data by age (orange circle: <65 and gray triangle: >65+). Panel B stratifies data by race/ethnicity (red circle: African American and White: blue triangle). Panel C shows 5-year survival by calendar interval and also stratifies data by race/ethnicity (red circle: African American and White: blue triangle).

