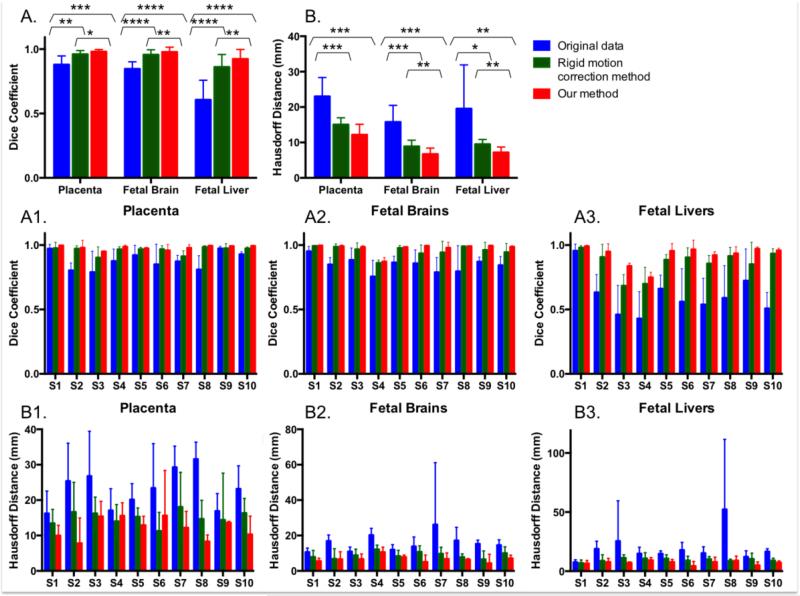
Figure 5.
Motion correction results for the placenta, fetal brain and fetal liver in 10 different subjects. Volume overlap, as measured by the Dice coefficient, and the distance between the boundaries, as captured by the Hausdorff distance, are reported in A and B for overall volumes and in A1-3 and B1-3 for individual subjects. Paired t-tests are used to compare the methods for each organ and reported in A and B: *p < 0.05, **p < 0.01, ***p < 0.001, ****p < 0.0001.

