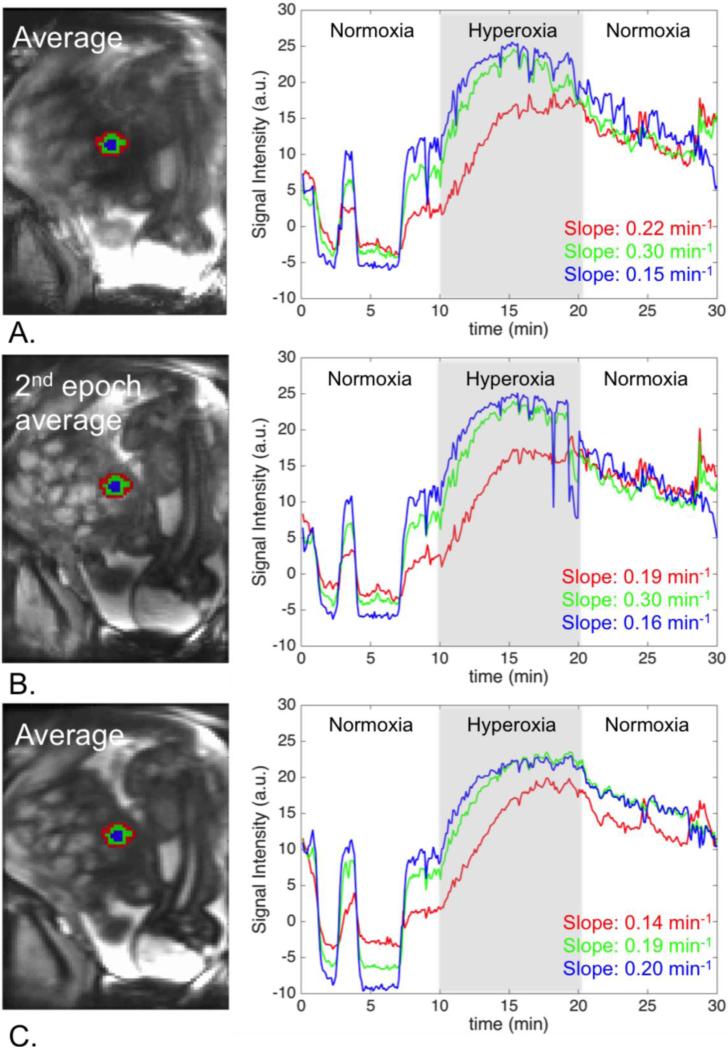
Figure 9.
Regional analysis of signal change: A. Original data, B. After rigid motion correction, C. Our method. Signal change over time is reported for a peripheral region (red), a middle region (green), and a central region (blue) in a single cotyledon. Our method produces the expected gradual increase in the signal change rate, which would have been missed if the baseline alignment method had been used.

