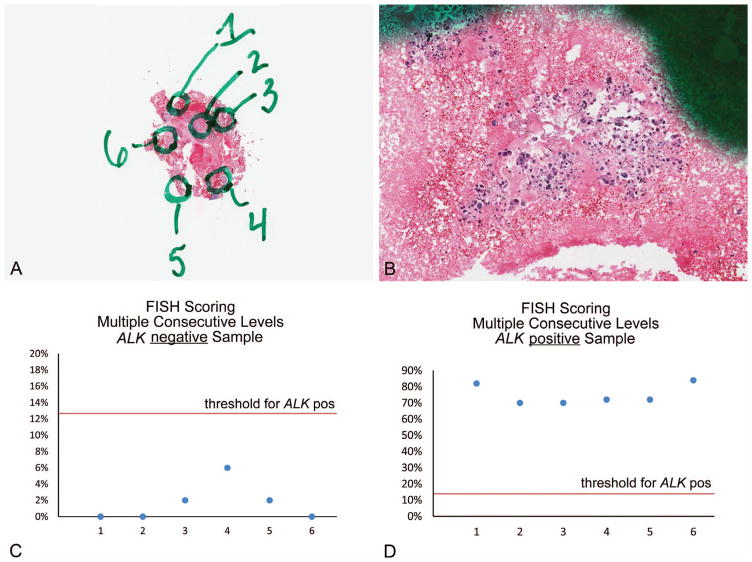
Figure 9.
A and B, Low- and moderate-power photomicrographs of an example case selected for validation of the “double-cut” methodology. Tumor cells were distributed in multiple foci of small clusters throughout the specimen. Six individual subareas were marked, and each area was separately scored on independently cut successive levels (5 total levels examined), to simulate a small specimen being scored with multiple successive levels. C and D, Scoring 5 consecutive levels of each marked subarea does not influence the overall result of the FISH analysis. Additional permutations of areas and levels to simulate different sized biopsy specimens and different numbers of sequentially scored levels demonstrated similar results (not shown) (hematoxylin-eosin, original magnifications ~×1 [A] and ~×100 [B]). Abbreviations: FISH, fluorescence in situ hybridization; pos, positive.

