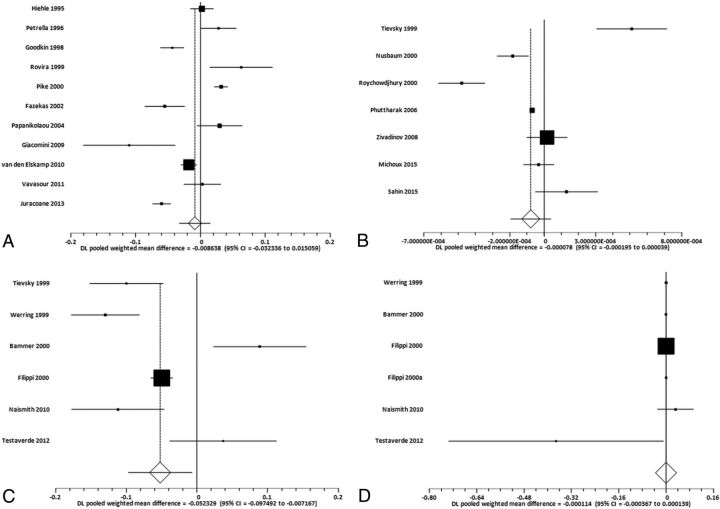
Figure.
Random-effects forest plots showing the SMD for specific MR imaging biomarker values between enhancing and nonenhancing lesions. Squares represent the point estimate for the SMD of each study, with the size of each square being proportional to the inverse of the variance of the estimate. The horizontal lines represent the 95% confidence intervals of each study. The diamond represents the pooled SMD estimate with the width of the diamond showing the 95% confident interval. A, SMD for MTR between enhancing lesions and nonenhancing lesions. B, SMD for ADC between enhancing lesions and nonenhancing lesions. C, SMD for FA between enhancing lesions and nonenhancing lesions. D, SMD for MD between enhancing lesions and nonenhancing lesions.

