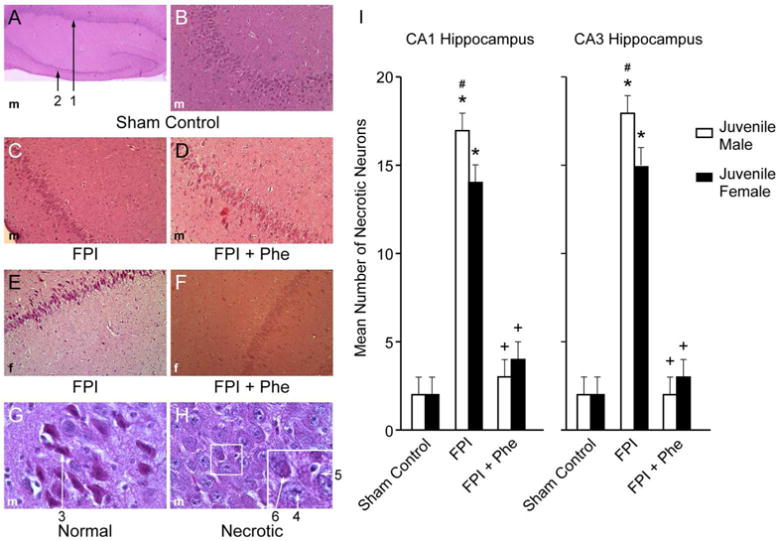
Figure 5.

(A) Low magnification (40×) typical juvenile male sham control showing both CA1 (#1) and CA3 (#2) hippocampal regions. (B) Higher magnification (100×) typical juvenile male sham control CA3 hippocampus. (C) Typical juvenile male FPI CA3 hippocampus (100×). D) Typical FPI + Phe juvenile male CA3 (100×). (E) Typical juvenile female FPI CA3 hippocampus (100×). (F) Typical FPI + Phe juvenile female CA3 hippocampus (100×), (G) High magnification (600×) typical viable sham control male neuron #3, with intact cytoplasm and darkly stained nucleus and (H) High magnification (600×) typical male necrotic neurons, showing # 4 pyknotic nucleus of small neuron, accompanied by neuronal cytoplasm shrinkage (#5) and granulated eosinophilic characteristics (“red dead” neuron) (#6) associated with cell death. Summary data for mean number of necrotic neurons (I) in CA1 and CA3 hippocampus of juvenile male and female pigs under conditions of sham control, FPI, and FPI + Phe, n=5. *p<0.05 compared to corresponding sham control value, +p<0.05 compared to corresponding FPI alone value, #p<0.05 compared to corresponding female value.
