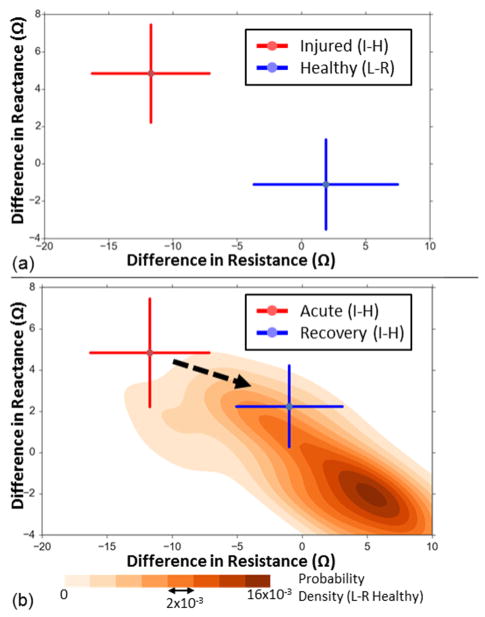
Fig. 2.
(a) The difference in resistance versus the difference in reactance for the healthy and injured subjects. For the healthy subjects (shown in blue, N=42), the difference is that between the left and the right knee (L–R) and for the injured subjects (shown in red, N=7) it is that between the injured and the healthy knee (I–H). The error bars indicate one standard deviation. (b) The difference in resistance versus the difference in reactance for the injured subjects (N=7), when the injury is acute (within one month of the measurement take, shown in red) and during recovery (four to seven months after corrective surgery, in blue). For these subjects, the difference shown is I–H. The probability density of the healthy subjects’ data (N=42, L–R difference), estimated using 2-dimensional Gaussian kernel density estimation is also visualized in shades of orange for comparison. The error bars indicate one standard deviation.

