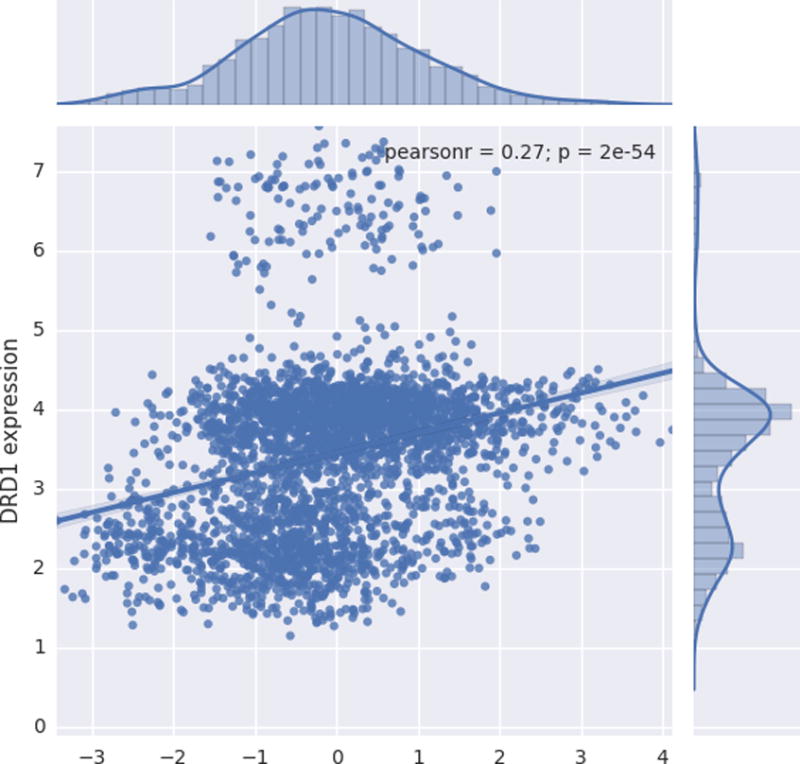
FIGURE 4.

Scatter plot depicting the relationship between normalized gene expression values (y axis) and t-statistic value (x axis) corresponding to the association between gray matter volume (GMV) and multi-informant average of ADHD symptoms. Positive t values indicate an inverse association between GMV and symptomatology, whereas negative t values represent a positive association between GMV and ADHD symptomatology.
