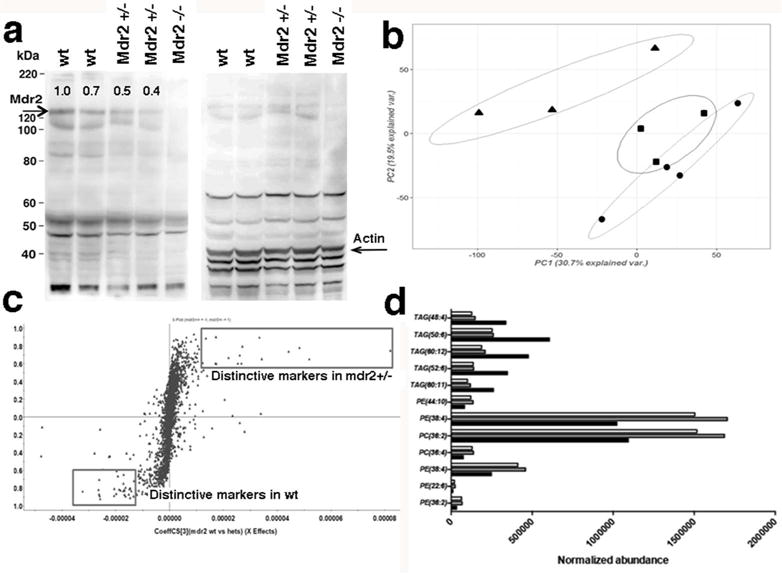
Figure 1.

Liver lipidomic patterns distinctly differ between neonatal wild type (wt) and Mdr2+/− mice. Protein blot analysis by SDS-PAGE was performed of crude hepatic protein extracts from neonatal mice. Numbers on blot in the left panel denote relative densitometry values for the intensity of the Mdr2-band at 140kDa normalized against the specific band recognized by the anti-Actin antibody at 43kDa in the right panel (a). Principal component analysis (PCA) of total 7281 features (4502 negative compound ions, 2779 positive compound ions) detected by mass spectrometry (MS) on liver tissue homogenates from neonatal Mdr2−/− mice (denoted as circles), Mdr2+/− (squares) and wt mice (triangles) following exhaustive lipid extraction; MS analysis was performed in triplicate for each sample and the intensity of each compound ion is reported as average of three injections (b). S-plot comparing Mdr2+/− (right upper quadrant) with wt (left lower quadrant) with each point representing one of the 2779 positive compound ions. Compounds farthest away from Y-axis correspond to significantly changed metabolites in each group (c). Quantification of lipid species from metabolomic analysis shows that phosphatidylcholines (PC) and phosphatidylethanolamines (PE) accumulate while several triglyceride (TAG) species are reduced in livers of Mdr2+/− (gray fill columns) and Mdr2−/− (no fill columns) compared with wt mice (black fill columns) in (d).
