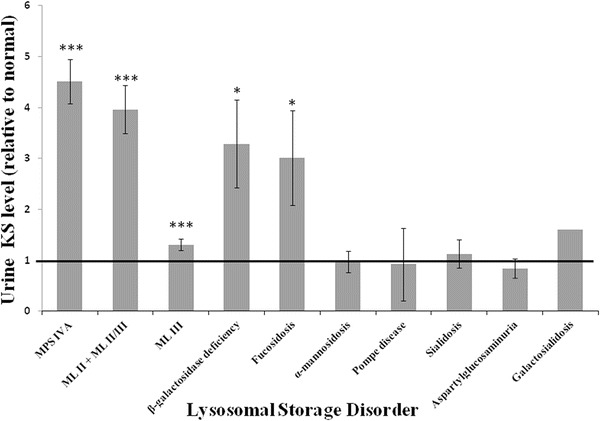
Fig. 3.

Urine KS in patients with various lysosomal storage disorders. The Y axis represents the average fold elevation relative to the upper limit of the age-specific reference range of urine KS (indicated by the bold black line) in each patient population. Patients with ML, fucosidosis, and beta-galactosidase deficiency have significantly higher urine KS levels than controls. No significant difference was observed between MPSIVA and ML II + II/III, fucosidosis, and beta-galactosidase deficiency patient samples. Error bars represent standard error of the means. * = P < 0.05; *** = P < 0.001; ### = P < 0.001. Statistical analysis performed by T-test
