Figure 3.
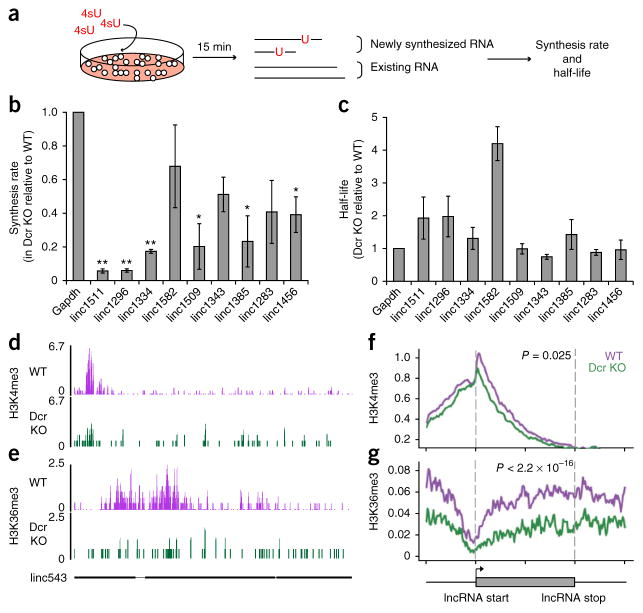
Dicer promotes lncRNA expression at the level of lncRNA transcription. (a) Schematic of 4sU experiment in WT and Dcr-KO mESCs. (b,c) Synthesis rate and half-life of lncRNAs, measured in Dcr WT and KO mESCs and displayed as a ratio of KO and WT (n = 3 trials for lincRNAs and n = 4 for Gapdh; *P ≤ 0.05; **P ≤ 0.01 by two-sided t test). Error bars, s.e.m. (d,e) Sequencing signals of H3K4me3 and H3K36me3 in WT (purple) and Dcr KO (green) mESCs at linc543 (nomenclature from ref. 15). The y axis represents number of reads per million. The gene structure of linc543 is shown at the bottom in black, with exons shown as black boxes. (f,g) Average signal intensity of H3K4me3 and H3K36me3 across downregulated lncRNA genes in WT (purple) and Dcr KO (green) mESCs. y axis represents average log2 value of normalized reads. P values indicate the significance of the area difference between WT and KO signals within the dotted line (two-sided Wilcoxon rank-sum test, n = 100 data points). The gray box at bottom represents the beginning and the end of an average lncRNA gene. The signals were also plotted for 50% up- and downstream of each lncRNA gene.

