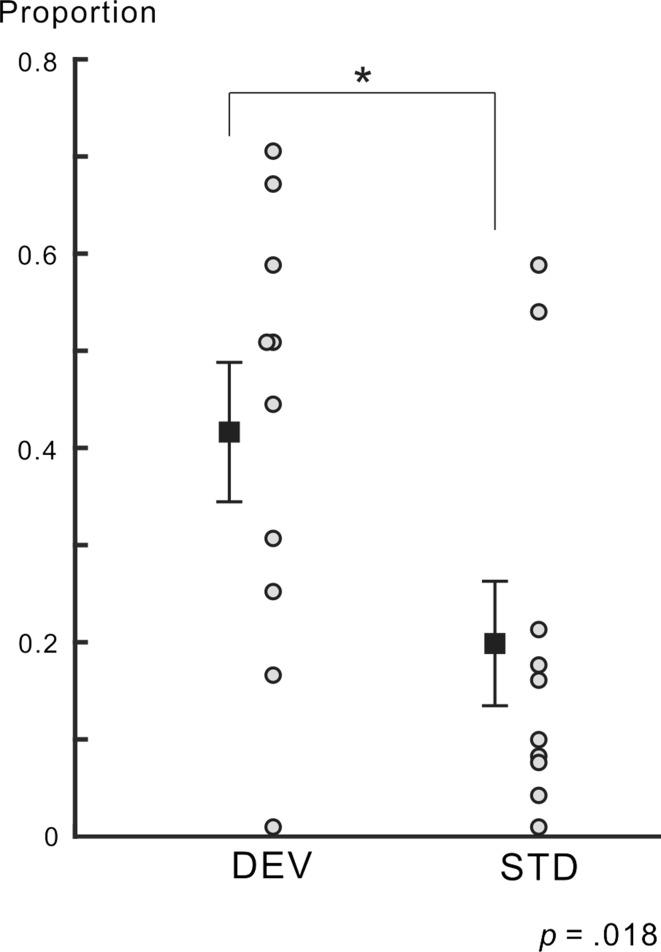
Fig. 2.
Proportion of perceptual alternation. The proportions of perceptual alternation for all participants are shown for DEV and STD targets. The mean proportion is indicated by a square with ± SE for each condition. The mean proportion of perceptual alternation in the DEV condition was significantly higher than that in the STD condition. Some data points are vertically shifted for display purposes

