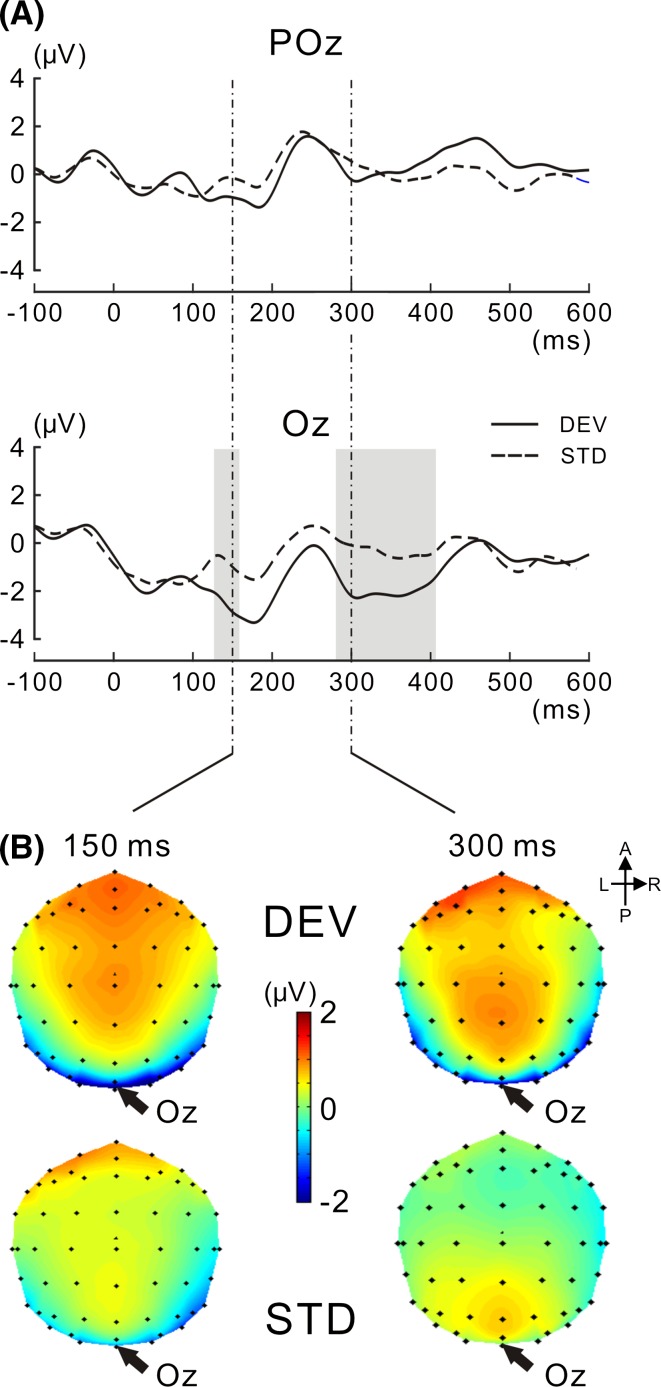
Fig. 3.
VEPs to the target image for DEV and STD targets. a VEPs at POz and Oz are shown for the DEV and STD targets, respectively. The VEP amplitude for the DEV target was significantly higher than that for the STD target. The time interval in which there was a significant difference is shaded in gray (for the procedure of the statistical analysis, see the “Methods” section). b Isocontour maps at latencies of 150 and 300 ms are shown for DEV and STD targets. In both latencies, VEP was negatively enhanced in amplitude at the posterior electrodes, particularly at Oz

