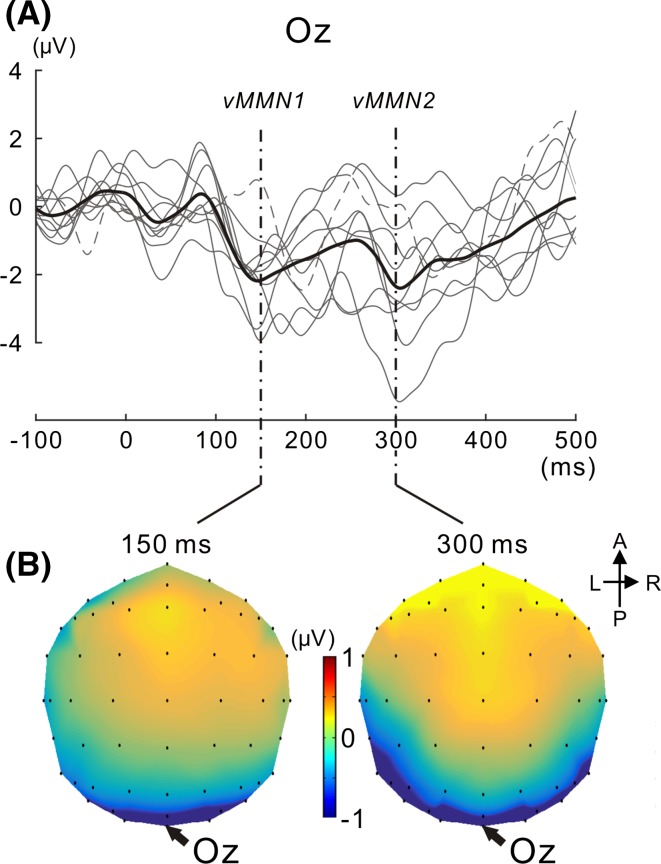
Fig. 4.
vMMNs for all participants. a vMMNs for all participants are superimposed with their mean. The mean is illustrated in bold black. vMMNs including outlier data are depicted as a dotted line (outlier data were defined for each of the vMMN1 and vMMN2 latency ranges, see the “Results” section). Two successive vMMNs (vMMN1 and subsequent vMMN2) appeared. b Isocontour map of the vMMN mean across participants is shown at 150 and 300 ms, respectively. The most prominent negativity emerged at Oz for both vMMN1 and vMMN2

