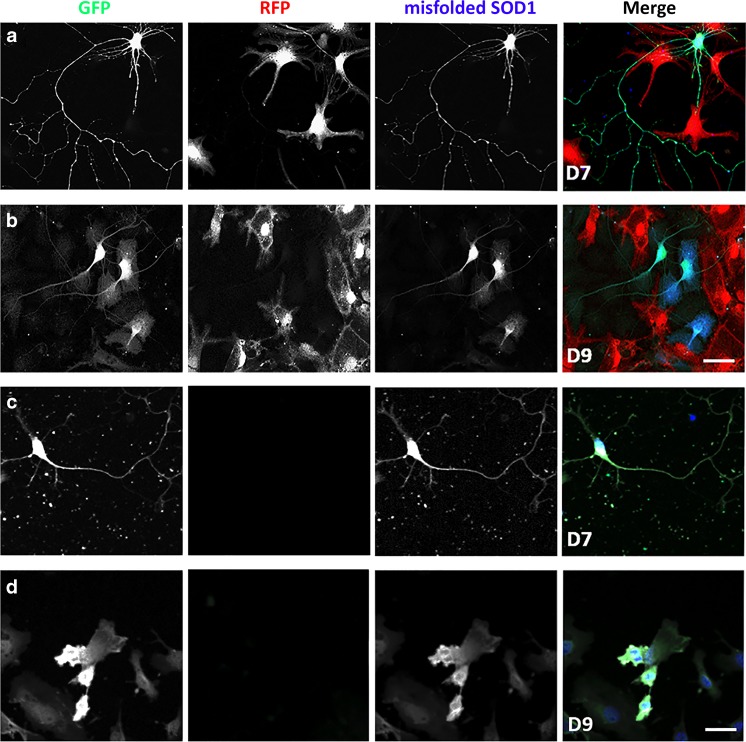
Fig. 3.
SOD1G93A MNs in the presence or absence of bNCSCs in vitro. Co-cultured SOD1G93A cells (GFP) and bNCSCs (RFP) display close contact on day 7 (a) and 9 (b), misfolded SOD1 was only detected in SOD1G93A MNs. SOD1G93A MNs cultured alone show reduced survival and the presence of misfolded SOD1 on day 7 (c) and day 9 (d). Scale bar: 50 μm

