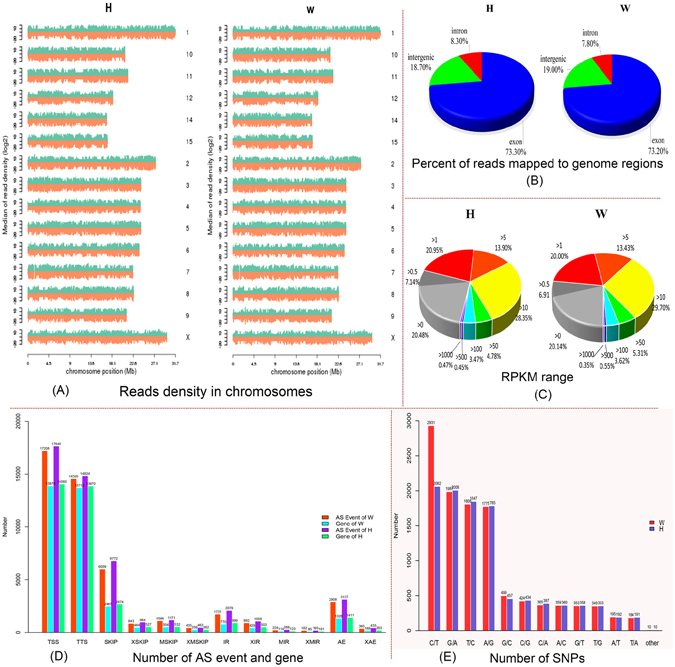
Figure 1.

Summary of basic sequencing data. (A) Density of total mapped reads (W and H). X-axis represents position on chromosome (million base pairs), and Y-axis represents log2(median reads density). Green and red regions represent positive and negative strands of chromosome, respectively. (B) Percentage of reads mapped to different genome regions (W and H). (C) Percentage of genes with different expression levels (W and H). (D) Distribution of alternative splicing events and associated genes in W and H samples. The orange and the purple bars indicate the number of alternative splicing events identified in W and H libraries, respectively. The cyan and the spring green bars indicate the number of genes associated with each type of the 12 alternative splicing events. (E) Distribution of SNPs identified in W and H libraries. The red and the slate blue bars indicate the number of SNPs in W and H libraries, respectively.
