Figure 2.

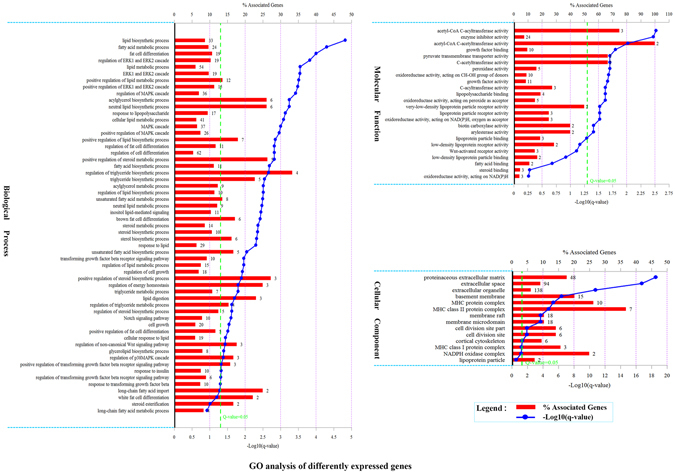
GO analysis of differentially expressed genes. The figure is composed of three parts: biological processes, molecular functions, and cellular components. The significance level of enrichment was set at corrected p_value (q_value) < 0.05.

GO analysis of differentially expressed genes. The figure is composed of three parts: biological processes, molecular functions, and cellular components. The significance level of enrichment was set at corrected p_value (q_value) < 0.05.