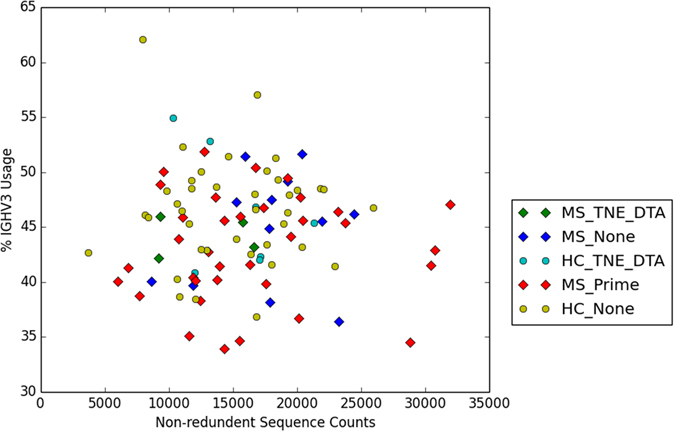
Figure 3.

All 51 patients and 46 Healthy Controls are represented in this 2D plot. The x-axis contains the nun-redundant patient sequence counts, obtained from column three of Supplementary Table 1. The y-axis contains the IGHV3 usage percentages obtained from column two of Supplementary Table 5. The data point shapes are determined by patient type. MS patients are represented by diamonds. Healthy Controls are represented by circles. The data points are further subcategorized by match type. Prime motif matches are categorized as “Prime.” TNE and DTA matches are categorized as “TNE_DTA.” All other matches are categorized as “None.” Though a few MS outliers are present in the plot, most patient data points appear to overlap regardless of categorization.
