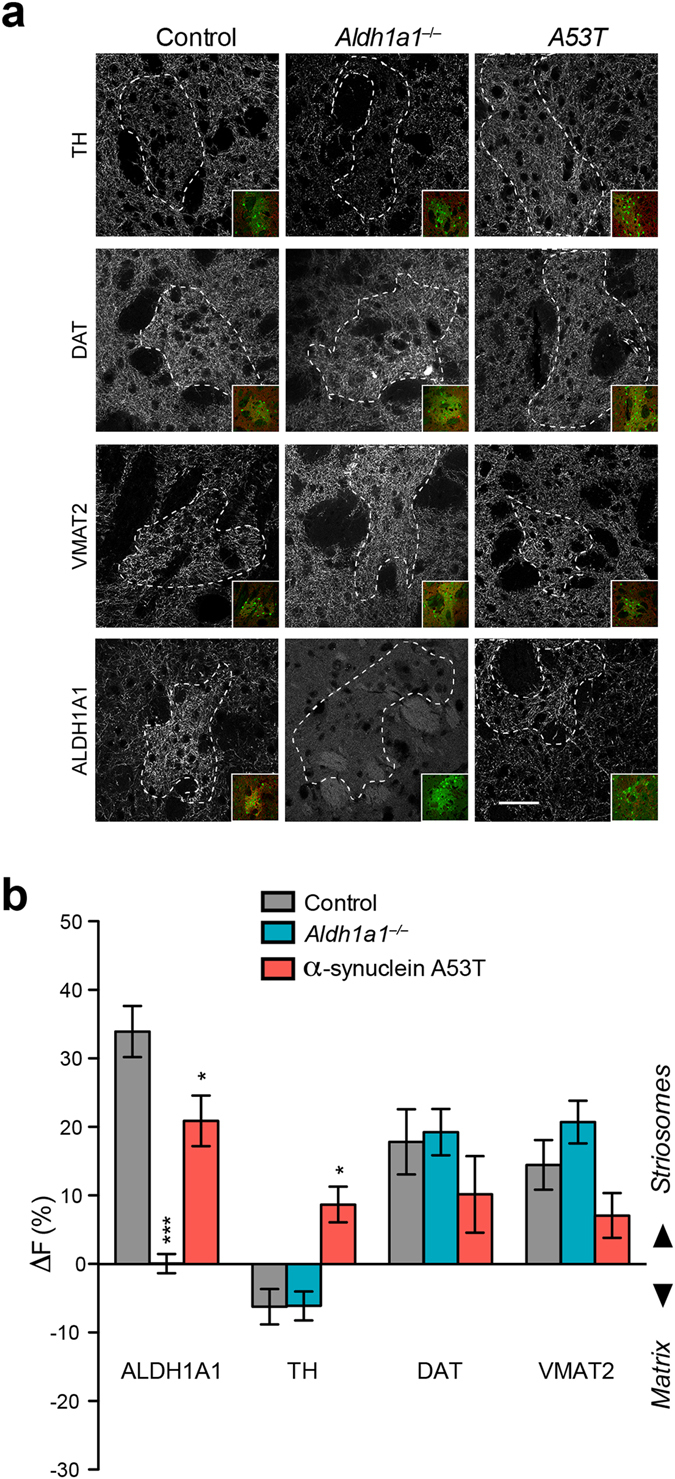
Figure 6.

Distribution of TH, DAT, VMAT2, and ALDH1A1 proteins in the striosomes and matrix of DLS. (a) Representative images show TH, DAT, VMAT2, and ALDH1A1 staining in the DLS of 1-month-old Nr4a-GFP mice in control, Aldh1a1 −/− and α-synuclein A53T mutant background. Dashed lines outline the striosomes. Inserts show co-staining with GFP to mark the strisomes. Scale bar: 50 µm. (b) Bar graph depicts the relative fluorescence intensity (ΔF) of ALDH1A1, TH, DAT, and VMAT2 staining in the striosome and matrix compartments (n = 5 animals per genotype, x matrix-striosome pairs per animal). Data were presented as mean ± SEM. One-way ANOVA was used for statistical analysis for each protein, followed by Bonferroni’s post hoc tests where Aldh1a1 −/− and α-synuclein A53T mutant were compared to Controls (*p < 0.05, ***p < 0.001).
