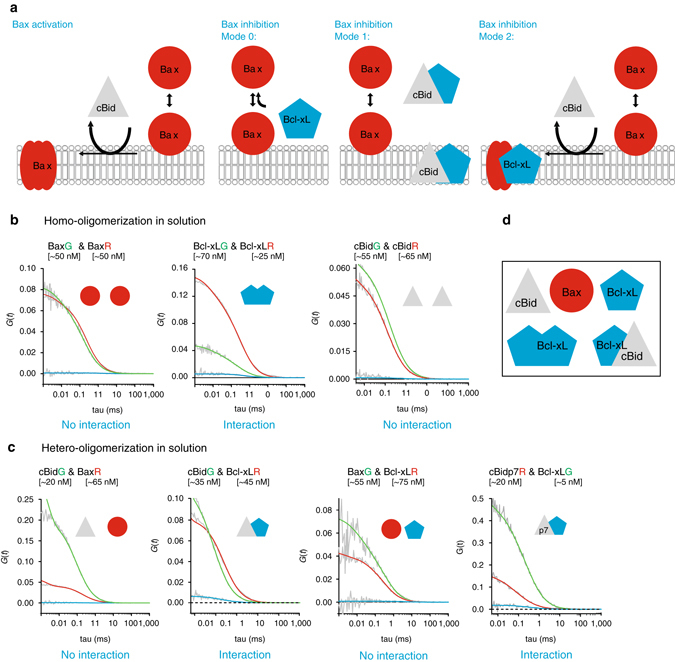
Fig. 1.

Analysis of interactions between cBid, Bax, and Bcl-xL in solution. a Representation of current models on Bax activation and inhibition by cBid and Bcl-xL. b, c Representative FCCS graphs of cBid, Bax, and Bcl-xL homo-hetero-oligomerization (B) and hetero-oligomerization in solution. For visual guidance: The amplitude of the AC curves is inversely proportional to the number of fluorophores, whereas the amplitude of the CC curves is proportional to the number of dual-color complexes. The decay of the AC and CC curves provides quantitative information on the diffusion properties of the particles and therefore of their size. All particle concentrations calculated from FCCS measurements refer to fluorescent particles that diffuse as a unit. Only Bcl-xLG/Bcl-xLR and cBidG/Bcl-xLR present positive CC amplitude (blue curve) indicative of interaction. The unfitted AC and CC curves are shown in grey (n ≥ 3 independent experiments), and the fitted AC curves corresponding to the species labeled with green and red fluorophores and shown in green and red, respectively. We studied interactions at different protein concentrations up to 200 nM. d Scheme of the five different monomeric and dimeric species that can be detected in solution. FCCS fluorescence cross correlation spectroscopy
