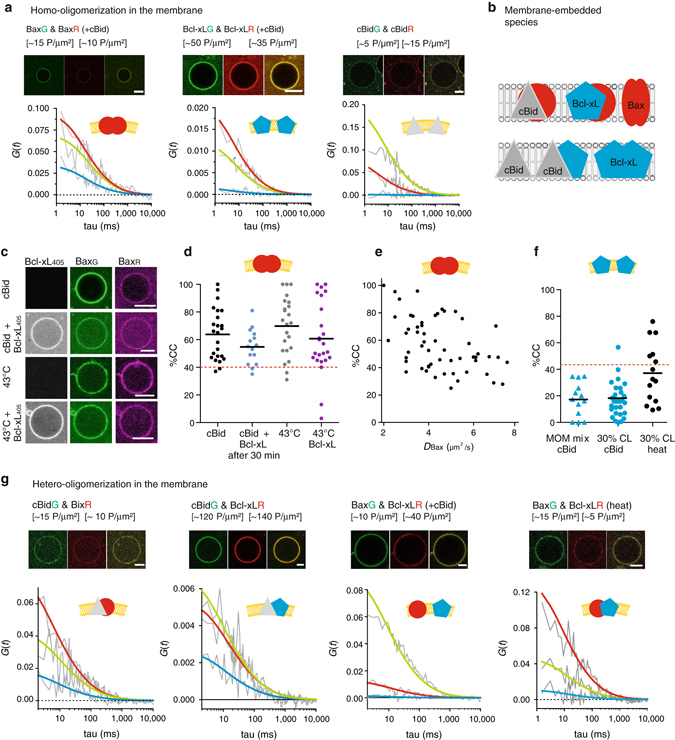
Fig. 4.

Analysis of the interactions between cBid, Bax and Bcl-xL within membranes. a Representative FCCS graphs and corresponding GUV images of cBid, Bax, and Bcl-xL homo-oligomerization in membranes (30% CL, Scale bar: 10 µm). Only the BaxG/BaxR pair presents positive CC amplitude indicative of interaction. The AC and CC curves are shown in grey, whereas the fitted curves are shown in green (green protein), red (red protein), or blue (complex). b Scheme of the different species that can be detected in the membrane. c Representative images of BaxR, BaxG, and Bcl-xL405 binding to GUVs (30% CL, Scale bar: 10 µm) in presence of unlabeled cBid or after incubation at 43 °C. d Comparison of the oligomerization expressed as %CC between BaxG and BaxR in individual GUVs after activation by cBid or 43 °C and in presence or absence of Bcl-xL405 (30% CL; n = 4). All data are from one batch of labeled Bax to ensure that the degree of labeling is the same under all conditions. The maximal possible %CC for dimer formation considering the degree of labeling and a Mendel-based distribution of red–red, red–green, and green–green complexes is indicated by the dotted red line. e Relationship between CC and D of BaxG and BaxR activated by cBid in individual GUVs (30% CL; n = 5 independent experiments using three independent Bax batches; degree of labeling 80–100%). The CC values of three experiments were already published in ref. 19 (see also Supplemental Fig. 8A–C). f Comparison of the CC between Bcl-xLG and Bcl-xLR in GUVs composed of the both lipid mixtures. Membrane insertion was induced by cBid or 43 °C. The dotted red line indicates the maximal %CC possible considering dimer formation (n = 3). Only one protein batch was used due to the same reasons as in d. Data from independent Bcl-xL batches are shown in Supplemental Fig. 8A, B. g Representative FCCS graphs and corresponding GUV images of cBid, Bax, and Bcl-xL hetero-oligomerization in GUVs (30% CL; Scale bar: 10 µm; color code as in a. FCCS fluorescence cross correlation spectroscopy
