Fig. 5.

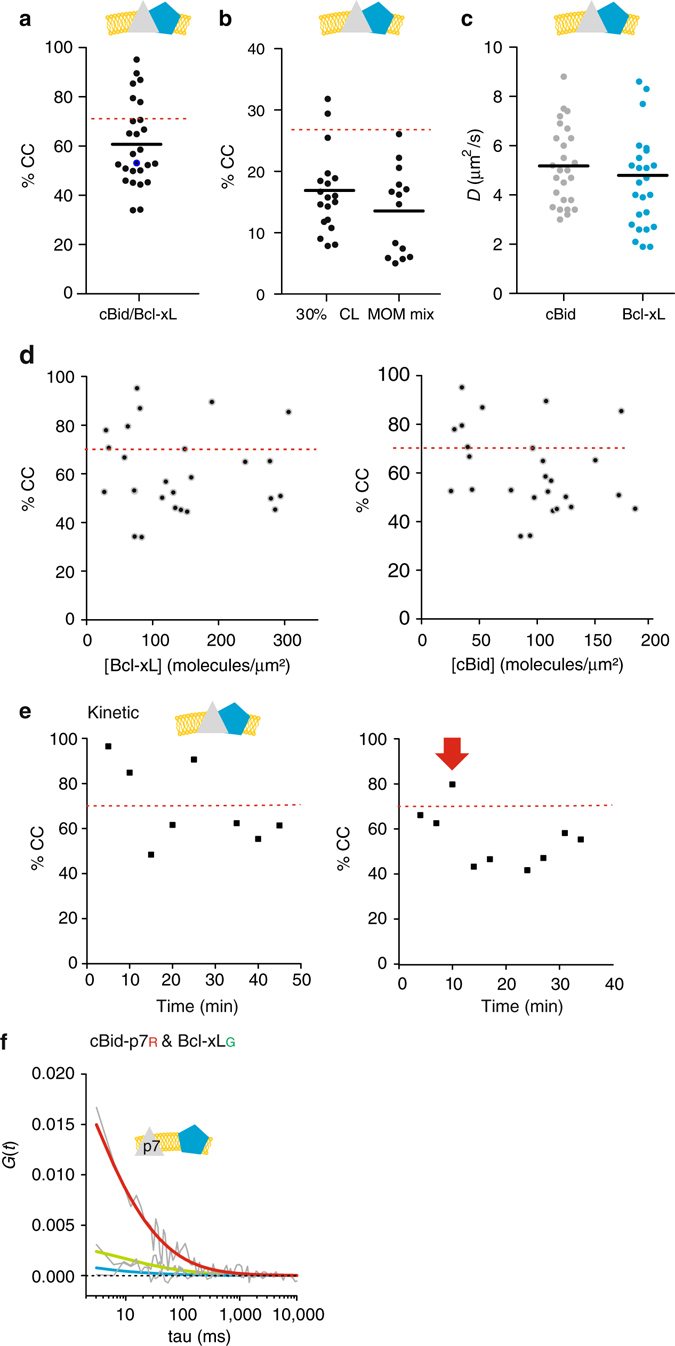
Quantitative analysis of cBid-Bcl-xL association in membranes. a %CC between cBidG and Bcl-xLR in membranes (30% CL; n = 5). b %CC between cBidG and Bcl-xLR in GUV membranes comparing both lipid mixtures (n = 3). c D of cBidG and Bcl-xLR in individual 30% CL GUVs (n = 5). d %CC vs. the cBidG or Bcl-xLR protein concentration in GUVs (30% CL; n = 5). e Evolution of %CC between cBidG and Bcl-xLR in two individual GUVs as a function of time. The red arrow marks the time point at which the GUV was permeabilized (see also Supplemental Fig. 9). f Representative FCCS graph of cBidp7R and Bcl-xLG interaction. The absence of positive CC indicates that the labeled proteins do not interact in the membrane (color code as in 4 A). In a, d, and e, the dotted red line indicates the maximal CC considering dimer formation and degree of labeling. FCCS fluorescence cross correlation spectroscopy
