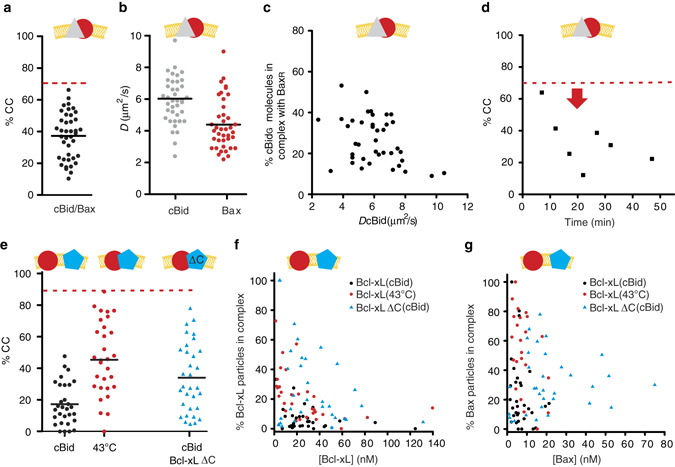
Fig. 6.

Quantitative analysis of the interaction of Bax with cBid and Bcl-xL in membranes. a, b %CC (a) and D (b) of membrane-embedded cBidG and BaxR in individual GUVs (30% CL; n = 8). c Percentage of cBidG molecules in complex with BaxR vs. the D of cBidG in individual GUVs (30% CL; n = 8). d Temporal evolution of %CC between cBidG and BaxR in a single GUV. The red arrow marks the time point at which the GUV was permeabilized (see also Supplemental Fig. 9). e Comparison of %CC between membrane-embedded BaxR (90% labeled) and Bcl-xLG (100% labeled) or Bcl-xLΔCTG (90% labeled) in individual GUVs (30% CL). Protein insertion into the membrane was activated by cBid or heat, as indicated (n = 3). f Percentage of membrane-embedded Bcl-xL or Bcl-xLΔCT molecules in complex with Bax in relation to the absolute concentration of Bcl-xL (after activation by cBid (black dots) or heat (red dots)) or Bcl-xLΔCT (blue triangles) (n = 3). g Percentage of membrane-embedded Bax molecules in complex with Bcl-xL (after activation by cBid (black dots) or heat (red dots)) or Bcl-xLΔCT (blue triangles) in relation to the absolute concentration of Bax (n = 3). The dotted red line in a, d, and e indicates the maximal possible CC considering the degree of labeling and dimer formation (n = 3). e–g Experiments done with one protein batch so that the results can be directly compared
