
Figure 3.
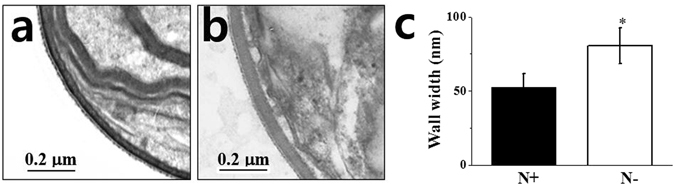
Representative TEM images of cell wall (a,b) and cell wall width (c) of N. salina cells grown under N+ and N− conditions for 2 days. In (c), the cell walls of a total of 250 individual N+ or N− cells were measured in five separate places.
Official websites use .gov
A
.gov website belongs to an official
government organization in the United States.
Secure .gov websites use HTTPS
A lock (
) or https:// means you've safely
connected to the .gov website. Share sensitive
information only on official, secure websites.
Representative TEM images of cell wall (a,b) and cell wall width (c) of N. salina cells grown under N+ and N− conditions for 2 days. In (c), the cell walls of a total of 250 individual N+ or N− cells were measured in five separate places.