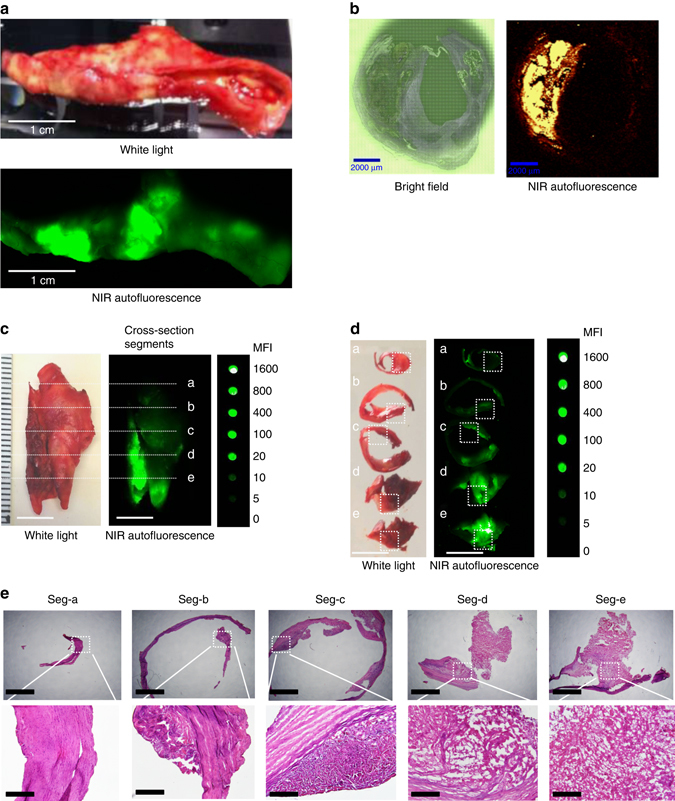
Fig. 1.

NIRAF imaging of human CEA samples and representative histology in five cross section segments. a Macroscopic sample of a fresh human CEA specimen under white light (upper photo) and fluorescence imaging using the Odyssey Infrared Imaging System (lower image) showing localized areas of NIRAF (n = 31). b Paraffin section of human CEA specimen (5 µm sections): Bright field (left) and areas of NIRAF on the WITek Raman 300R system at 785 nm excitation (right, n = 5). c Fresh human CEA specimen under white light (left) and its NIRAF image using Odyssey Infrared Imaging System (middle) shown in comparison with a serial dilution of IRDye800CW (Em = 794 nm) (right). The same sample was sectioned into five segments (seg-a–seg-e) along the dash lines labeled “a”–“e” as shown in c. Scale bars indicate 1 cm (n = 8). d These five plaque segments (seg-a–seg-e) under white light (left) and their corresponding NIRAF images using Odyssey Infrared Imaging System (middle) were again shown in comparison with the IRDye800CW (right). Seg-a has MFI of 2, seg-b = 10, seg-c = 20, seg-d = 200, and seg-e = 1000, respectively. Scale bars indicate 1 cm (n = 8). e Histology of these five plaque segments with increasingly advanced pathology stained with hematoxylin and eosin. Seg-a: intimal thickening only. Seg-b: some lipid accumulation. Seg-c: atheroma with multiple foam cells. Seg-d and seg-e: fibroatheroma with intraplaque hemorrhage. Scale bars indicate 500 µm in the upper row and 100 µm in the lower row (n = 8). MFI = mean fluorescence intensity. Square dash box indicates the magnification position and reference points in the original NIRAF and under white light images
