
Fig. 2.
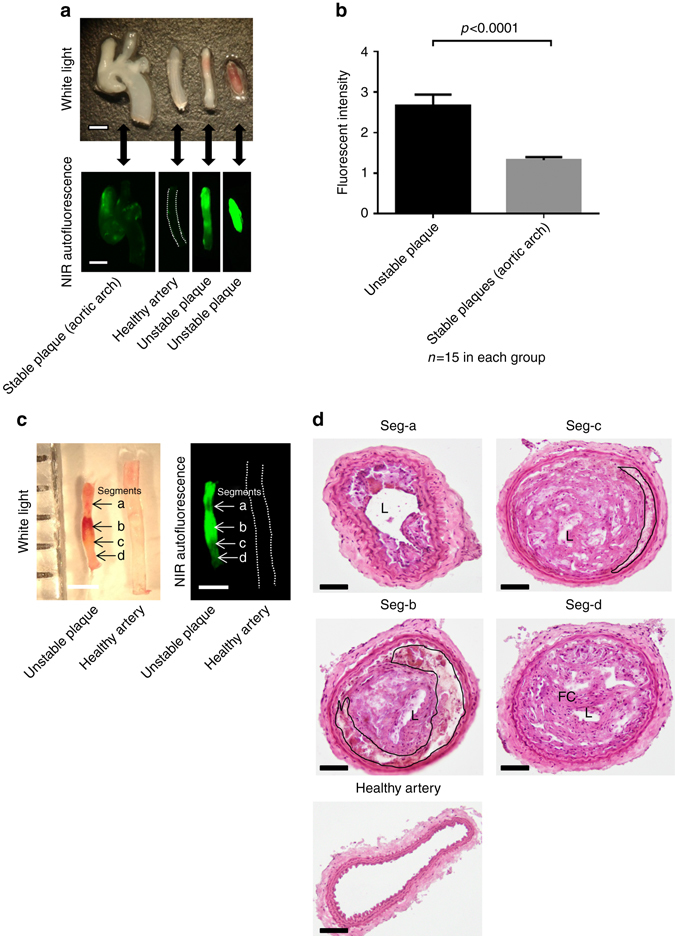
NIRAF imaging and intraplaque hemorrhage in the TS mouse model. a Macroscopic samples (upper photo) of different arterial segments from the murine TS model: from left to right: aortic arch with adjacent vessels representing stable plaques, healthy carotid artery, unstable atherosclerotic plaque with modest intraplaque hemorrhage and unstable atherosclerotic plaque with extensive intraplaque hemorrhage (both segment I of different mice) and representative NIRAF pictures (lower images) of their corresponding arterial segments obtained with the Odyssey Infrared Imaging System (n = 15). b Bar graph comparing NIRAF intensity (mean ± SEM) of unstable plaques to stable plaques in the tandem stenosis model in 15 mice. There was a significantly higher NIRAF signal in unstable plaques compared to stable plaques (p < 0.0001, Student’s t-test). Unstable and stable plaques were defined by histological features as outlined by Chen et al.16 c White light (left) and NIR images (right) of an unstable atherosclerotic plaque in comparison to a healthy artery, which served as background control signal. NIRAF signals were mainly co-localized with the regions of gross intraplaque hemorrhage (arrow labeled with b). d Histological images using hematoxylin and eosin staining of serial cross sections of the same samples shown in c (atherosclerotic plaque and normal healthy artery). Seg-a shows an intermediate lesion while seg-b exhibits extensive intraplaque hemorrhage (black line indicates the hemorrhage region). Seg-c also exhibits modest intraplaque hemorrhage and seg-d shows a thick cap fibroatheroma. L, lumen, FC, fibrous cap, TS, tandem stenosis. Scale bars indicate 1 mm in a and c and 100 µm in d