
Fig. 3.
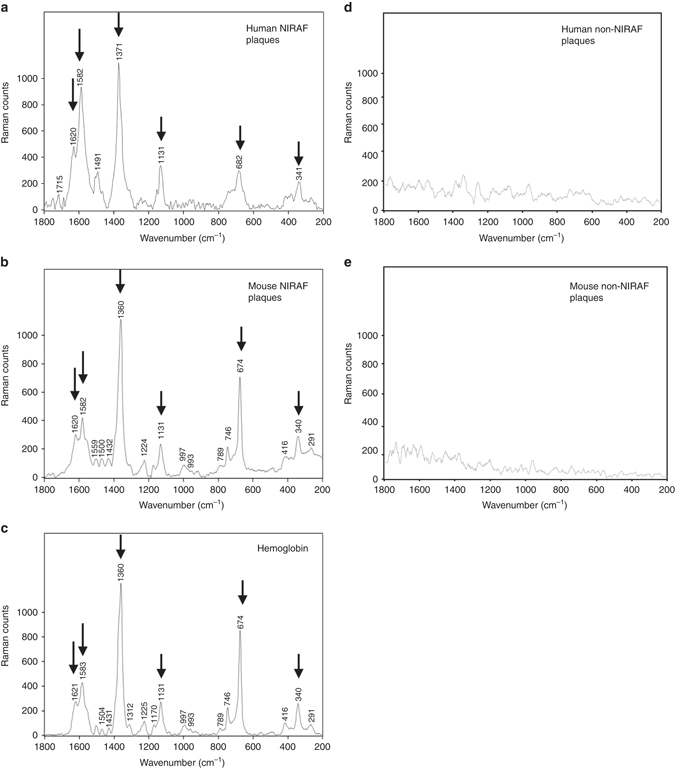
Raman signals obtained from human and murine carotid plaques with or without NIRAF. a Raman signals from a NIRAF human CEA sample (5 µm cryosection) showing the oxidation state marker band ν 4 at 1371 cm−1 assigned to a symmetric pyrrole half-ring stretching vibration consistent with the Fe ion being in the ferric state associated with oxygenated hemoglobin. b Raman spectra from NIRAF murine carotid sample (40 µm cryosection). The spectra of the plaques appear to show a mixture of heme products as evidenced by the position of ν 4, which appears at 1360 cm−1 indicative of ferrous heme but also shows a shoulder feature at ~1371 cm−1, which is associated with ferric heme indicating a mixture of oxygenated and deoxygenated hemoglobin. In oxygenated hemoglobin, which is in the ferric low spin state, this band normally appears between 1376 and 1370 cm−1. In deoxygenated hemoglobin, where the Fe ion is in the ferrous high spin state, this band normally appears between 1360 and 1350 cm−1. A number of other strong heme bands are observed in the spectra of the plaques. These include bands at 1620 cm−1, 1582 cm−1, 1544 cm−1 assigned to C=C and C–C bonds of the porphyrin backbone a, b. c Raman signals obtained from hemoglobin demonstrated almost identical peaks with murine NIRAF plaques at 1620, 1582, 1360, 1311, 1225, 789, 674, 416, 340, and 291 cm−1. d Raman signals from a human non-fluorescent plaque and e Murine non-fluorescent plaques demonstrated no specific chemical finger prints. Arrows indicate the major heme peaks