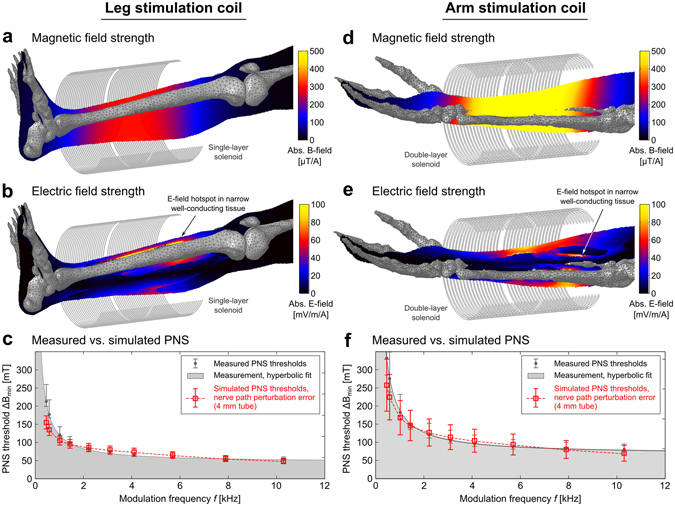
Figure 8.

Calculated PNS thresholds as a function of coil current frequency for a leg coil and an arm coil compared to previously published experimentally measured thresholds49. In c and d we plot the measured and simulated PNS thresholds (amplitude of applied B-field which creates an action potential) as a function of coil current frequency. The error bars in the simulated PNS thresholds (red boxes) derive from the nerve path sensitivity analysis. Namely they represent the standard deviation of the thresholds over the 20 segments simulated within the 4 mm tube around the atlas nerve center.
