
Figure 8.
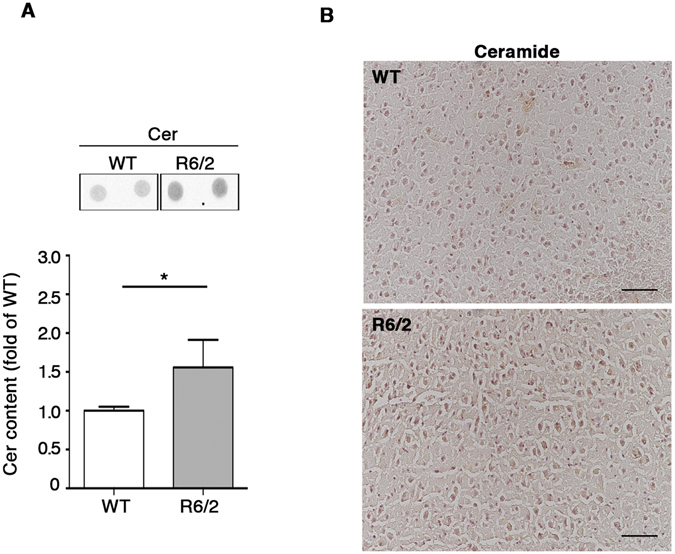
Levels of ceramides are increased in cortical tissue from R6/2 mice at early stages of the disease. Representative dot blotting and densitometric analysis (A) and immunohistochemical micrograph. Scale bar in each micrograph represents 100 µm. (B) of Cer content in the cortex of early manifest (6 week old) R6/2 mice and WT littermates. Data are represented as mean ± SD. N = 5 for each group of mice. *p < 0.05 (Unpaired t-test).