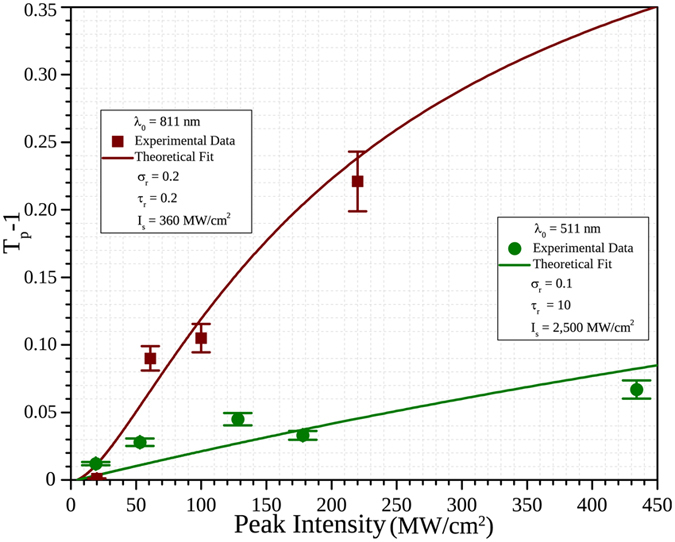
Figure 5.

Experimental data and best-fit calculations for the maximum NLA change given by T p − 1 at both the dipolar (red squares for experiment data and red solid line for theoretical fit) and the quadrupolar (green circles for experiment data and green solid line for theoretical fit) regimes. While the quadrupolar regime shows an early saturation effect at low intensities, the dipolar response saturates at much higher peak intensities.
