
Figure 5.
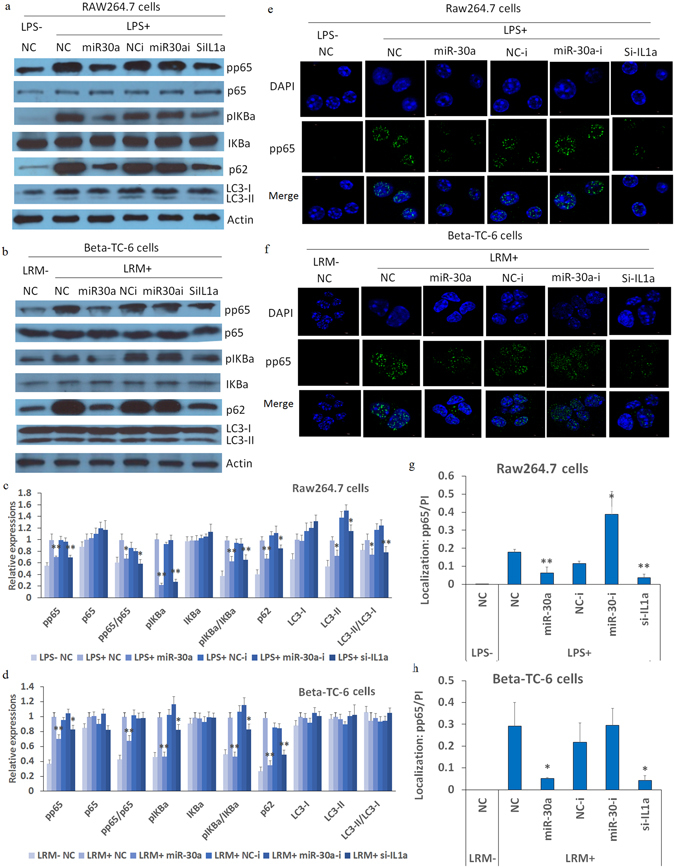
Effects of miR-30a mimics on inflammatory and autophagy factors and NFKB activity in RAW264.7 and Beta-TC-6 cells subjected to inflammatory stimulation. (a and b) Western blotting showing that miR-30a mimics significantly inhibit the increases of pp65, pIKBa and p62 in RAW264.7 and Beta-TC-6 cells after 24 h of LPS and LRM, respectively (the uncropped images are available in Supplementary Fig. S3); (c and d) the relative expression was calculated by the ratios of gray density values of protein bands to actin. (e–h) IF and confocal assays showing that miR-30a mimics significantly inhibited pp65 translocation into the nucleus in RAW264.7 and Beta-TC-6 cells after 24 h of LPS and LRM induction, respectively. The gray density values of fluorescence proteins and DAPI were calculated by ImageJ software, and these protein levels in cells were normalized with DAPI (PI). Approximately 100 cells in each slide (3 slides per group) were randomly selected and the average value in each slide was obtained for further statistical analysis. LRM+/−, incubation with or without LRM; NC, negative controls of miRNA mimics; NC-i, negative controls of miRNA inhibitors or siRNA; miR-30a-i, miRNA-30a inhibitor; and si-IL1a, silencing mRNA fragment of Il-1a. Data are expressed as the Mean ± SD (n = 3); *P < 0.05 and **P < 0.01 vs. NC or NC-i (LPS/LRM+), respectively.