Figure 3.

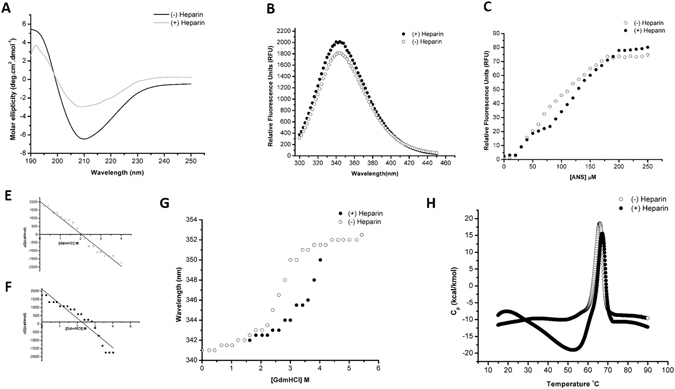
Effect of heparin on the conformation and stability of hIL12. (A) Overlay of the far-UV CD spectra (190 nm–250 nm) of hIL-12, in the absence (solid black) and presence (solid gray) of heparin. (B) Overlay of the steady-state fluorescence emission spectra on hIL-12 in the absence (empty circle) and presence (filled circle) of heparin. (C) Overlay of the equilibrium unfolding curves of IL-12, in the presence (filled circle) and absence (empty circle) of heparin. (D,E). A plot of the concentration of GdmCl [M] versus ΔG (cal/mol) to determine the concentration (Cm) of the denaturant required for denaturation of 50% of the protein population, present in the native conformation. (G) Overlay of the ANS binding curves of hIL-12 in the absence (empty circle) and presence (filled circle) of heparin. (H) Overlay of the thermal denaturation curves of hIL12 in the absence (empty circle) and presence (filled circle) of heparin. Thermal denaturation was carried out by ramping the temperature at a rate of 1 °C/min. Data obtained was plotted as heat capacity at constant pressure (Cp) versus temperature (°C) to obtain the Tm of hIL12.
