
Figure 3.
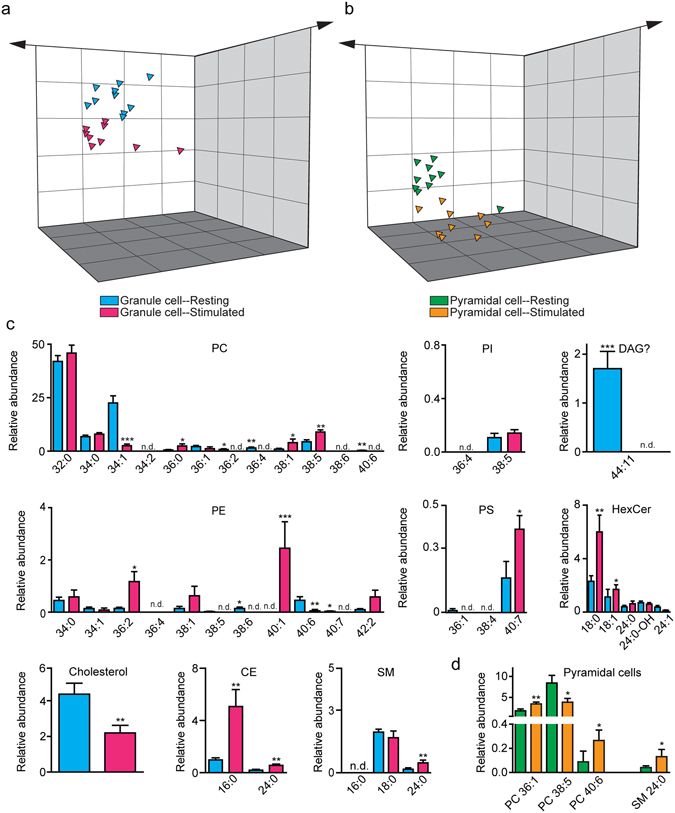
Effects of physiological stimulation on the lipidome of individual hippocampal neurons. Principal component analysis of lipids from resting and stimulated (a) DG granule cells (blue: resting; magenta: stimulated) or (b) CA1 pyramidal cells (green: resting; orange: stimulated). Relative quantification of individual lipid species from (c) resting (blue bars) or stimulated (magenta bars) granule cells; and (d) resting (green bars) or stimulated (orange bars) pyramidal cells. Results are represented as mean ± s.e.m (n = 10 single neurons per group); *P < 0.05; **P < 0.005; ***P < 0.001; Mann-Whitney U test.