
Figure 7.
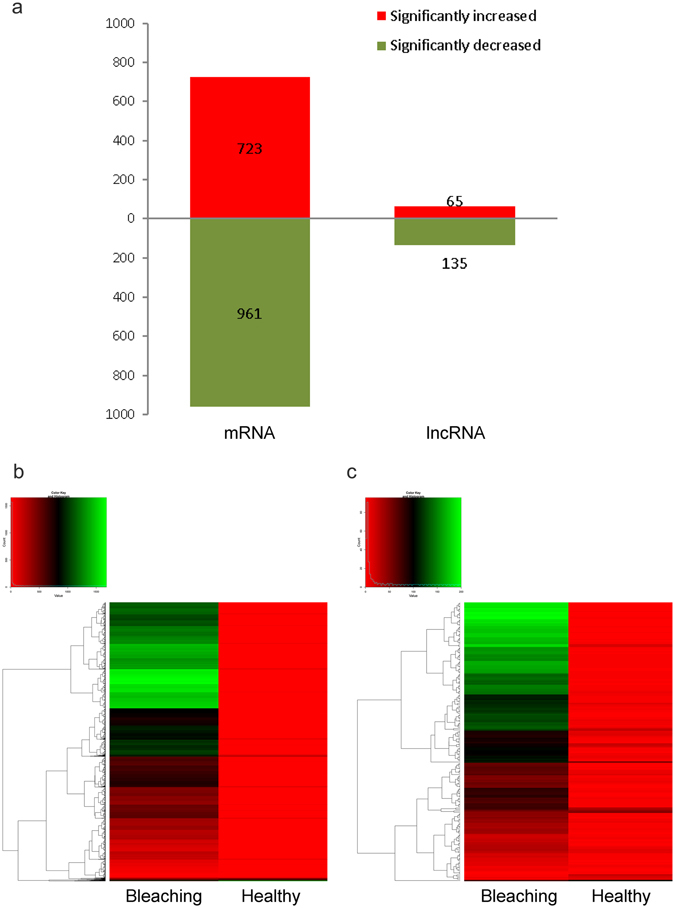
Comparison of differentially expressed mRNAs and lncRNAs identified in healthy P. caribaeorum and in colonial individuals undergoing bleaching. (a) Histogram plot of significantly differentially regulated mRNAs and lncRNAs in P. caribaeorum tissue undergoing bleaching compared to healthy tissue. (b,c) Hierarchical clustering and scatter plot of overall mRNAs (b) and lncRNAs (c) differentially expressed in P. caribaeorum tissue undergoing bleaching compared to healthy tissue. Red: lower expression levels, green: higher expression levels.