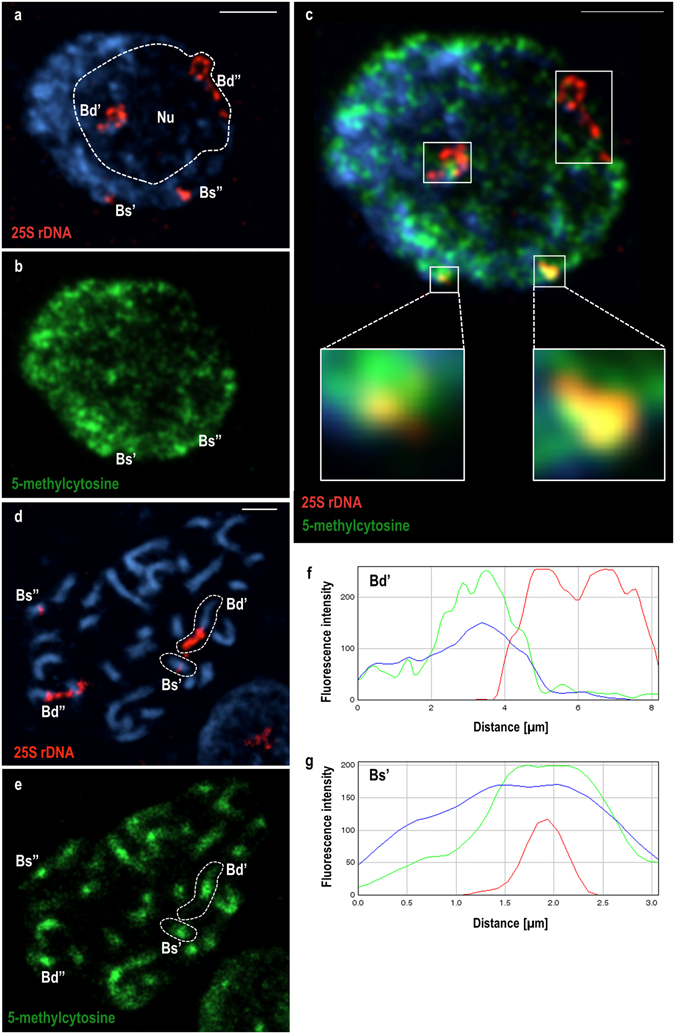
Figure 1.

DNA methylation patterns of 35S rRNA genes in B. hybridum. (a) FISH with 25S rDNA (red fluorescence) as a probe in the representative interphase nucleus of B. hybridum (genotype ABR113). (b) 5-MeC immunopattern (green fluorescence) in the same nucleus. (c) Superimposed images of nucleus after FISH with 25S rDNA (a) and signals of 5-MeC residues (b). B. stacei-inherited 35S rDNA loci are enlarged in the insets. (d) FISH with 25S rDNA (red fluorescence) as a probe in the mitotic metaphase chromosomes of B. hybridum (genotype ABR101). (e) 5-MeC foci distribution in the metaphase complement shown on (d). (f,g) 5-MeC foci distribution along the longitudinal axes of chromosomes Bd’ (f) and Bs’ (g) which are surrounded by dashed line on (d,e). The blue curves denote the fluorescence intensity of the counterstain (DAPI), the green curves indicate the distribution of methylation foci. The position of the 35S rDNA loci is shown by the red curves. The length of chromosomes is shown on the x-axis in microns, while the fluorescence intensity on the y-axis is presented in arbitrary units. Nu – nucleolus. Scale bar: 5 µm.
