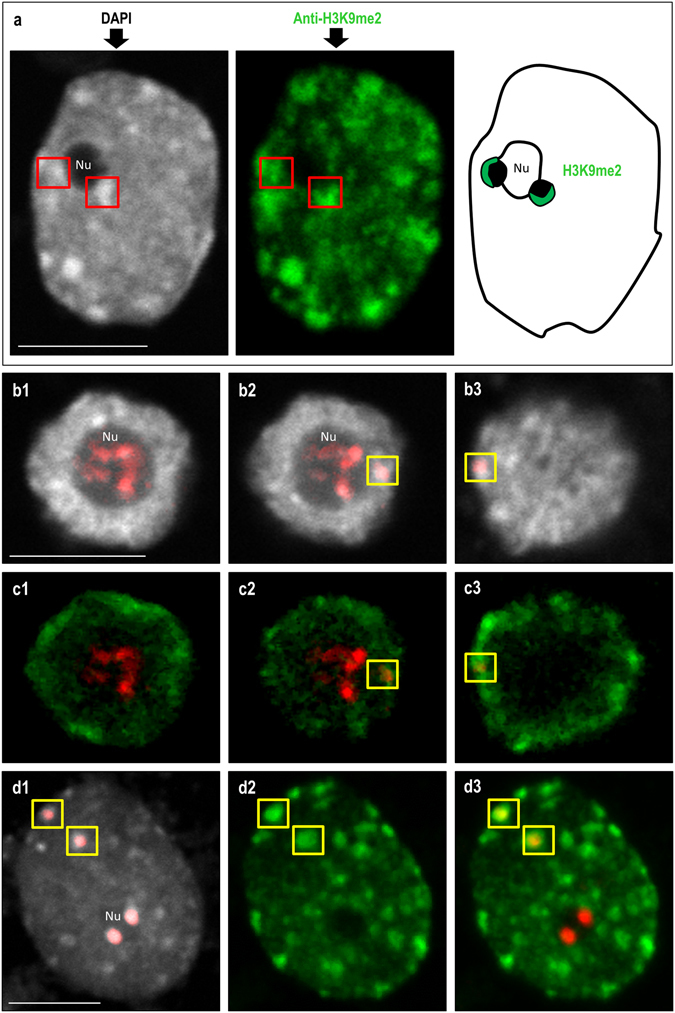
Figure 6.

Distribution of heterochromatic marker H3K9me2 in the nuclei of B. hybridum. (a) H3K9me2 immunopattern in the chromocentres adjacent to the nucleolus. (b1–b3; c1–c3) H3K9me2 foci distribution in the nucleus without distinct heterochromatic domains. Three example sections through the representative nucleus are presented. (b1–b3) FISH with 25S rDNA (red) as a probe. (c1–c3) H3K9me2 foci (green) distribution and 25S rDNA FISH signals (red) in the sections through nucleus presented on (b1–b3). (d1–d3) H3K9me2 foci distribution in the nucleus with chromocentres. (d1) FISH with 25S rDNA (red) as a probe. (d2) H3K9me2 foci distribution in the nucleus shown on (d1). (d3) H3K9me2 foci (green) distribution and 25S rDNA hybridisation signals (red) in the nucleus presented on (d1). The locations of B. stacei-originated 35S rDNA loci are indicated by yellow insets. Nu–nucleolus. Scale bar: 5 µm.
