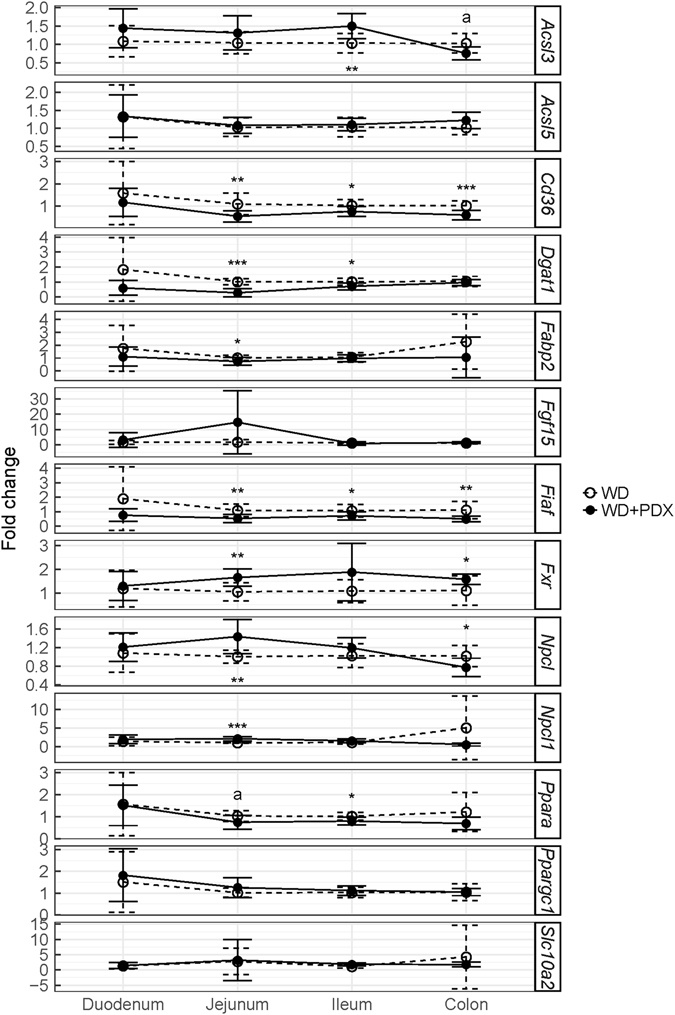
Figure 2.

Gene expression analysis of Acsl3, Acsl5, Cd36, Dgat1, Fabp2, Fgf15, Fiaf, Fxr, Npcl, Npcl1, Ppara, Ppargc1 and Slc10a2 in duodenum, jejunum, ileum and colon. Dgat1, Cd36, Fiaf and Fxr showed consistent statistically significant differences between WD and WD + PDX mice in jejunum, ileum and colon. Npcl1, Npc1, Acsl3, Fabp2 and Ppara showed statistically significant difference either in jejunum or ileum or colon between WD and WD + DX mice. The letter “a” represents nearly significant changes. The values are presented as mean ± SD. *p ≤ 0.05, **p ≤ 0.01, ***p ≤ 0.001.
