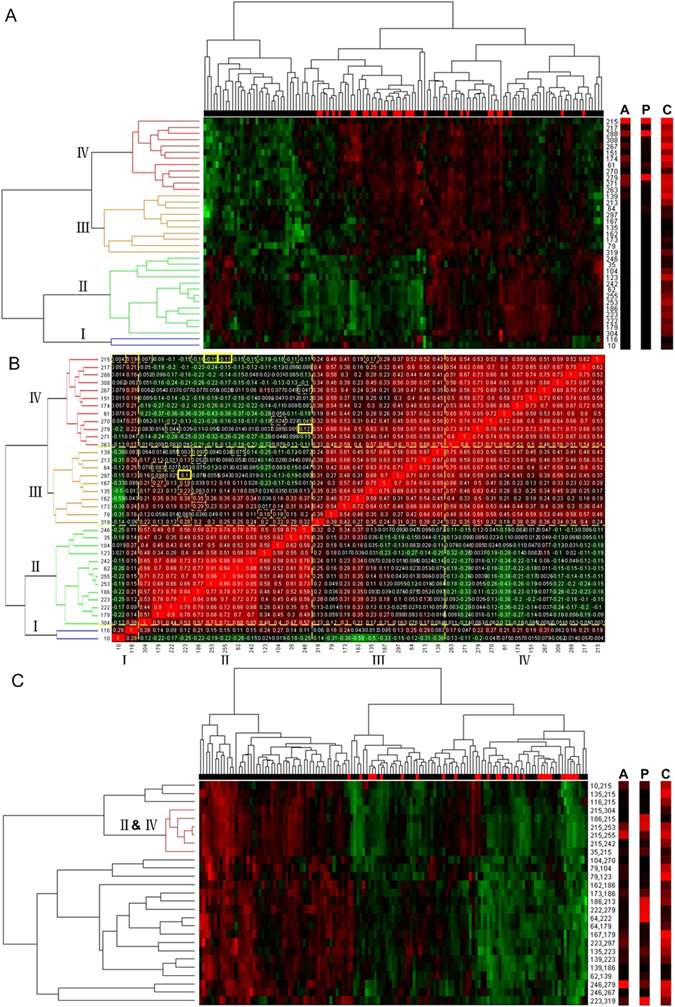
Figure 3.

Correlation analyses at step A5. Row labels instead of probe names are illustrated in display convenience. The corresponding probe names can be found in Supplementary Tables S1 and S2. Bars labeled with A, P and C correspond to the overall scores of A5 accumulation, p-values and classification error rates, respectively. Panel (A) indicates a hierarchical clustering with complete linkage and centered Pearson correlation after z-score transformation of linear expression projections at step A1. Panel (B) contains the correlations reordered by the clustering results of Panel (A). Correlations of the 27 pairs chosen at step A4 are labeled with yellow boxes, of which the most significant pairs are labeled in bold. Panel (C) is also a hierarchical clustering under the same treatment as that of Panel (A), except that it is for each pair of probes.
