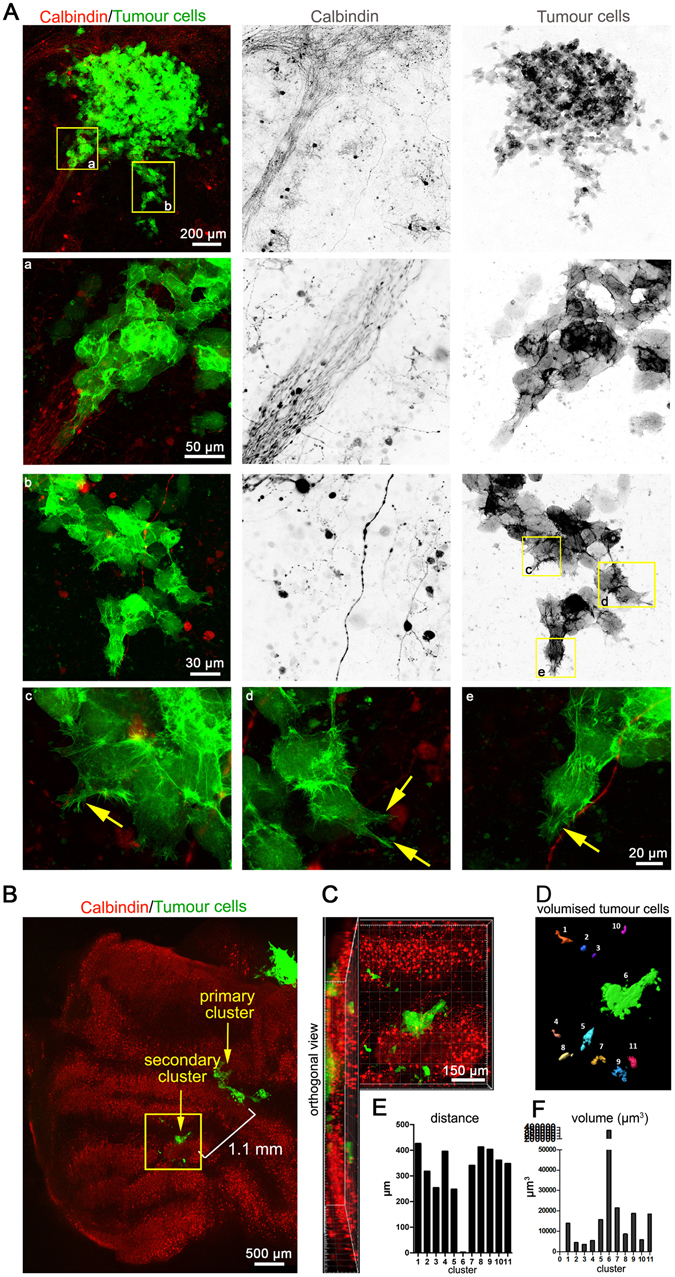
Figure 3.

Qualitative and quantitative analysis of MB cell behaviour in co-culture. (A) Visualisation of the co-culture initiated for 5 days. Morphological assessment of the invading cells was performed (boxed insets a to e and their respective zoomed in versions). (B) Purkinje cell/tumour cell co-culture visualisation 12 days after implantation. (C) Zoomed version of the boxed area in A and its orthogonal view. (D) Volumisation of the tumour clusters in B using Imaris. Graphical representation of the distance of the satellite tumour cells from the tumour cluster 6 (E) and tumour volume (F). Inverted grey scale images show individual channels for better visualisation of cellular structures. a - e are 63x zoomed-in images of the yellow boxed areas. Arrows point to invasive lamellipodia- and filopodia-like protrusions in invading cells.
