
Figure 4.
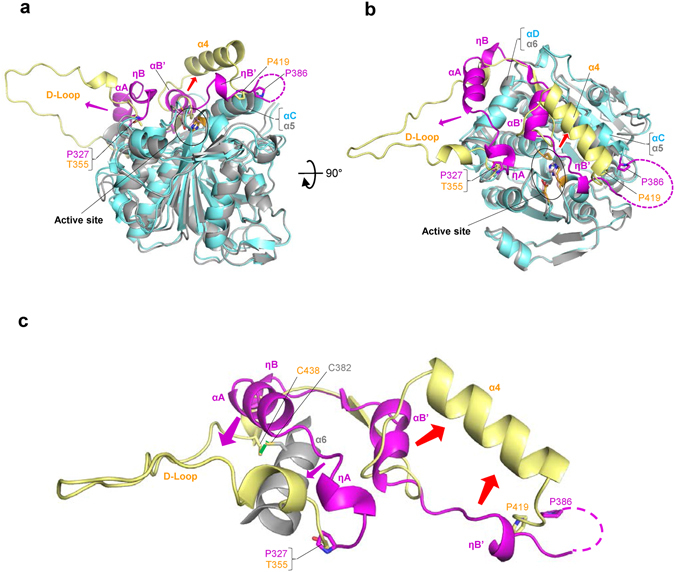
Conformational changes in the CAP subdomain as revealed by structural comparison of PhaCCs-CAT and PhaCCn-CAT structures. (a) A side-view of the overlay between PhaCCs-CAT (cyan and magenta) and PhaCCn-CAT (gray and yellow) with an overall r.m.s. deviation of 2.7 Å for Cα carbon atoms. The major conformational deviations are observed in part of the CAP subdomain, the LID region (residues Pro327–Pro386 in magenta) of PhaCCs-CAT, which corresponds to the segment Thr355–Pro419 (yellow) of PhaCCn-CAT. Arrows indicate conformational transitions of the LID region from PhaCCs-CAT to PhaCCn-CAT. (b) As in a, but a top-view down to the active site. A narrow path to the active site was found in PhaCCn-CAT, whereas the path is covered by the LID region in PhaCCs-CAT. (c) To clarify the conformational transitions found by the structural comparison of PhaCCs-CAT and PhaCCn-CAT, overlay of the LID regions of the two structures are shown. Unfolding of ηA, αA and ηB helices of PhaCCs-CAT into a long flexible D-loop found in PhaCCn-CAT is indicated by magenta arrows, and refolding of αB’ and ηB’ helices and their linker loop of PhaCCs-CAT into a long α4 helix in PhaCCn-CAT by red arrows. The disulfide bond between Cys328 and Cys438 of PhaCCn-CAT is shown in green.