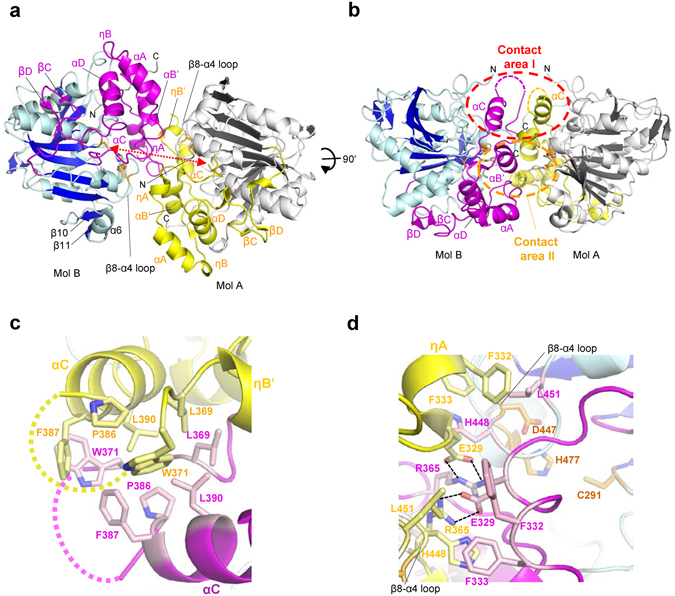
Figure 5.

PhaCCs-CAT forms a dimer in the crystal. (a) A top-view of the PhaCCs-CAT dimer along the pseudo-dyad axis. The color codes of mol B are the same as in Fig. 1, with mol A core (gray) and CAP (yellow) subdomains shown. The distance between the catalytic cysteine residues is 28.1 Å (red double-headed arrow). (b) As in a, but the side-view. Contact areas I (red) and II (orange) are indicated by broken circles. The N-termini of both protomers are located at the same side of the dimer. (c) Contact area I forms a hydrophobic cluster with nonpolar residues from ηB’-αC loop (Leu369, Trp371) and αC helix (Pro386, Phe387, Phe390) from both protomers. The segment (Asn372-Thr383) between ηB’-αC loop (Leu369, Trp371) and αC helix are disordered in our crystal (dashed lines). (d) Contact area II contains salt bridges (Arg365–Glu329) buried inside the interface formed by nonpolar residues of ηA helix (Phe332, Phe333) and β8-α4 loop (His448, Leu451) from both protomers. Hydrogen bonds are indicated by broken lines.
