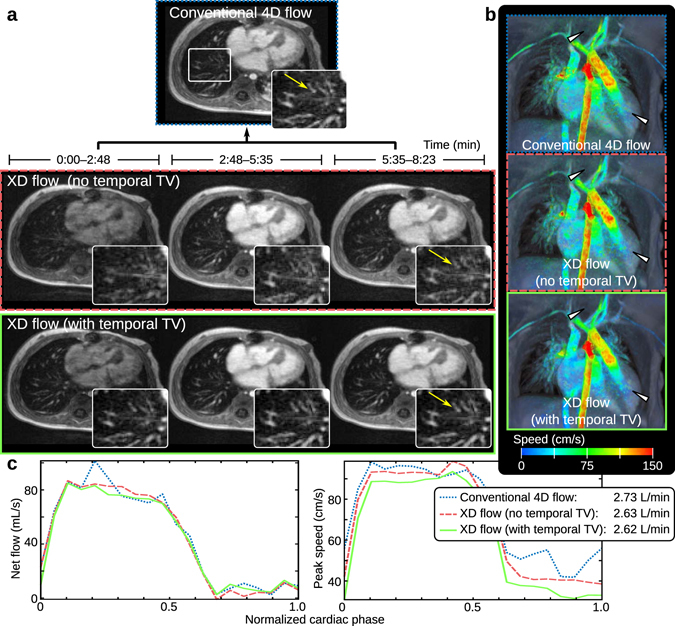
Figure 4.

XD flow of a 11-month-old female with reconstruction R1 to minimize the impact of contrast signal fluctuations during the administration of gadofosveset trisodium. In (a), the conventional 4D flow of the 8:23 min scan is displayed above the XD flow reconstruction without the temporal total variation constraint (middle) and with the temporal constraint (bottom). The recovery of fine pulmonary vessels (yellow arrow in magnified view) can be seen when exploiting the temporal dimension in the XD flow reconstruction. Surface renderings with velocity overlaid of each reconstruction (last temporal phases for the XD flow reconstructions) are displayed in (b). Reduction of noise in the velocity can be observed when comparing the XD flow with conventional 4D flow (white triangles). The lowest noise is observed in the XD flow reconstruction with the temporal total variation constraint. In (c), flow (net flow and peak speed) is measured in the aorta root. The average flow of 2.6–2.7 L/min for all three methods are similar.
