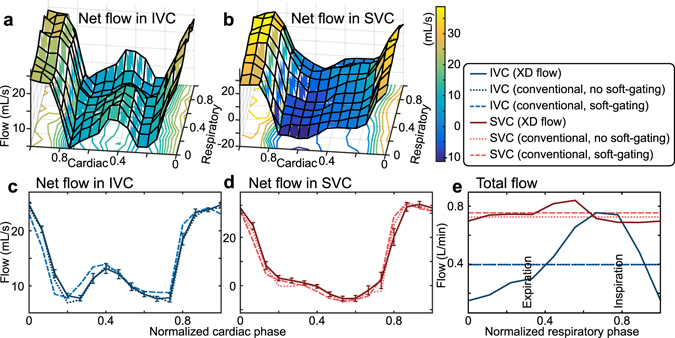
Figure 5.

Ferumoxytol-enhanced XD flow reconstruction of a 3-year-old female highlighting the impact of respiration on flow analysis. The net flow through the inferior vena cava (IVC) and the superior vena cava (SVC) are plotted as a function of normalized cardiac and respiratory phase in (a) and (b). The average net flow across the different respiratory phases is plotted in (c) and (d) as a function of normalized cardiac phase. Blood flow measured in a conventional 4D flow reconstruction (with and without respiratory soft-gating) of the same dataset is also plotted in (c) and (d) as dotted and dashed lines. In (e), the total flow in the IVC and SVC is plotted as a function of normalized respiratory phase. The total flow is observed to be dependent on the respiratory phase. This feature is ignored in the conventional 4D flow reconstructions (dotted/dashed lines).
