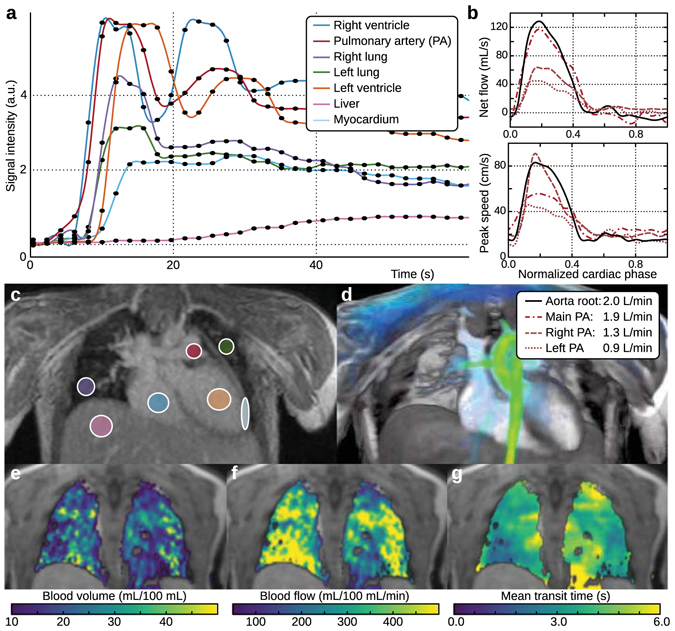
Figure 6.

Dynamic-contrast-enhancement/perfusion reconstruction with XD flow of a 2-year-old male with the administration of gadobutrol. Contrast dynamics (2-s temporal resolution) of specific tissues are depicted in (a) with the corresponding ROI drawn in (c). The same dataset can also be reconstructed to depict flow information as plotted in (b) and visualized in (d). In (a), the initial enhancement of the right ventricle can be seen with the initial peak. The contrast recirculating through the system can be observed with the secondary peak. Pulmonary enhancement can be seen with the ROIs drawn on the right and left lungs. Pulmonary perfusion maps are displayed as pulmonary blood volume (e), pulmonary blood flow (f), and mean transit time (g). The enhancement of the lungs is after the enhancement of the right ventricle and pulmonary artery.
