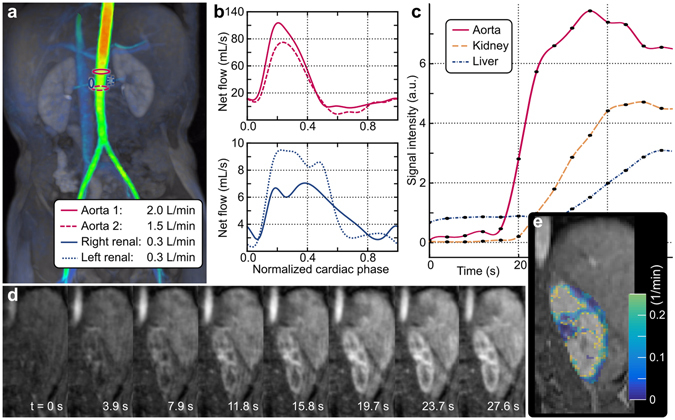
Figure 7.

XD flow imaging using reconstruction R3 in the abdomen of an 8-year-old male with gadobutrol administration to enable comprehensive kidney assessment. Blood flow velocities are visualized with a surface rendering in (a) and net flow plotted in (b). The blood flow in the aorta was measured superior (solid red) and inferior (dashed red) to the renal arteries (blue) to demonstrate internal consistencies with flow measurements. The same dataset is reconstructed at a 3.9-s temporal resolution. The signal enhancement curves are plotted in (c) and the dynamics are highlighted in the left kidney in (d). From this dataset, a glomerular filtration rate map is generated and displayed in (e).
