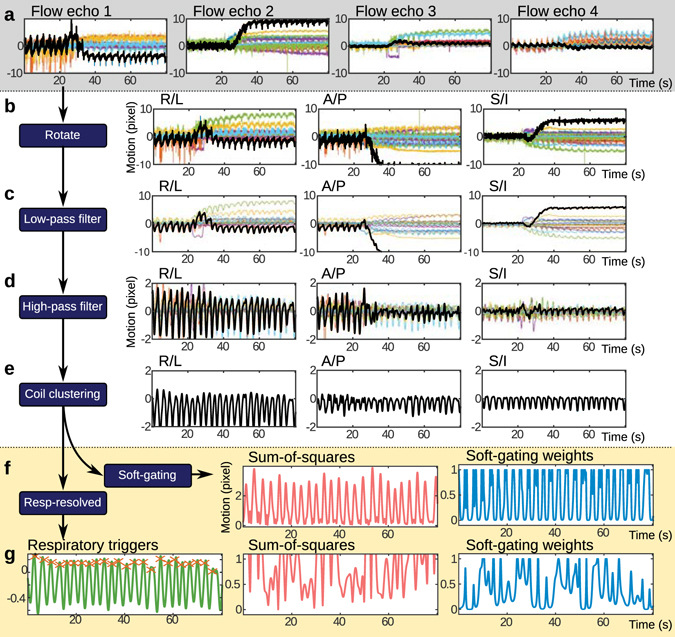
Figure 8.

Processing of motion estimates for physiological signal monitoring. From the 4 different velocity-encoded echoes (4 flow echoes), 4 different directions of motion are measured using the Butterfly navigators and are plotted in terms of image pixels in (a). Each color represents a different channel from a 32-channel cardiac coil receiver. In (b), these estimates are rotated to the conventional right/left (R/L), anterior/posterior (A/P) and superior/inferior (S/I) directions. In (c), a low-pass filter tuned with a cut-off frequency based on the recorded cardiac rate is used to remove the cardiac signal and noise. In (d), a high-pass filter is applied to remove the low-frequency drifting that is partially attributed to the contrast administration. In (e), a coil-clustering algorithm is used to extract the dominate motion. Afterwards, the motion estimates can be directly used to compute soft-gating weights (f) or further processed for respiratory-resolved imaging (g). For respiratory-resolved imaging, the respiratory trigger points can be located and used to determine respiratory phases. Soft-gating weights based on residual patient motion from changing respiratory depth or bulk patient motion can then be computed.
