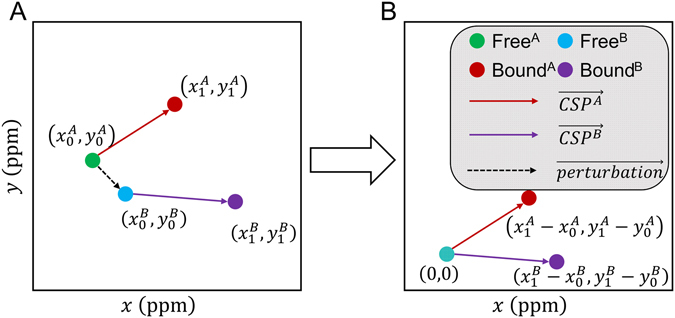
Figure 4.

Calculation of CSP vectors to represent peak shifts from ligand binding for the PCA and CONCISE analyses. The x-axis refers to the 1H chemical shift scale of the TROSY spectra and the y-axis the 15N chemical shift scale normalized by 0.2-fold to the 1H scale. (A and B) refer to wt PMM/PGM and PMM/PGM(S108C). (A) Green and cyan symbols represent their initial peak positions and brown and purple symbols their positions when shifted by ligand or covalent modification. (B) In order to compare perturbations of covalently different A and B species, their initial peak positions are shifted to the origin at (0, 0). The CSP vectors of A and B share this origin. Ligand-binding perturbations refer to the initial free state as the origin. EdeP refers to EP as the origin. In the biplots, the S108C perturbation refers to wt EP as the origin.
